

If you require a copy of this Report in any other format, please contact enquiries@TSCG.ac.uk with your specific accessible requirements and we will send you a modified copy.
| Author | Naomi Harrop |
| Version Date | July 2025 |
| Approved By | Board of Governors |
| Academic Year | 2024–2025 |
| Publication | Internal and External |
1. Introduction
2. Our Whole Group Approach to Equality, Diversity and Inclusion (EDI)
3. Statement from the Board of Governors
4. Learning: Review of Progress Against EDI Objectives
5. Student Demographics
6. Staff: Impact and Progress
7. Community and Partnerships
8. Looking Ahead (2025–2026)
9. Pay Gap: Gender
10. Conclusion
Trafford and Stockport College Group (TSCG) stands as a leading provider of inclusive education and skills development across Greater Manchester. In the academic year 2024–2025, TSCG delivered high-quality learning opportunities to over 6,000 young people, more than 6,000 adults, 1,500 apprentices, and 400 university centre students, supported by a dedicated team of over 900 colleagues. Our curriculum spans academic, vocational, technical, higher education, adult education, apprenticeships, and commercial programmes, ensuring a broad offer that meets the needs of diverse learners and the regional economy.
TSCG’s mission is to unlock the potential of students, colleagues, local businesses, and communities, creating a place where individuals are empowered and lives are transformed. Our partnerships are extensive and impactful, including collaborations with local authorities, employers, community organisations, and national bodies. Notable partnerships in 2024–2025 included digital skills initiatives with Kao Data, employer engagement through the Airport Skills Hub, and community anchor projects supporting care leavers and jobseekers. We serve communities across Trafford and Stockport, engaging with over 100 businesses, supporting thousands of residents into work, and hosting events that foster inclusion and opportunity.
Our role as a community anchor institution is reflected in our commitment to equity, diversity, and inclusion. We actively support learners from a wide range of backgrounds, including those from deprived areas, ethnic minority groups, and individuals with additional needs. Our strategic priorities are aligned with the Greater Manchester Strategy and government ambitions, focusing on curriculum innovation, exceptional student experience, financial sustainability, and environmental and social responsibility.
A significant contextual factor for both boroughs is the level of deprivation experienced by students. In the 2024–2025 academic year, approximately 70% of TSCG students resided in deprived postcode areas—a figure that is notably higher than the national average and has continued to rise year on year. This highlights the critical role that TSCG plays in supporting social mobility and widening participation, ensuring that learners from all backgrounds have access to high-quality education and opportunities for progression.
Our mission is to unlock potential and transform lives by providing inclusive, high-quality education and skills development for all. TSCG aims to create opportunities for success, regardless of background, and to support students, staff, and local employers through ambition, collaboration, and respect.
TSCG continues to embed EDI through a whole-organisation approach, aligning strategy, culture, and operational practice.
Our EDI Strategy 2022–2025 is underpinned by four priority areas:
During 2024–2025, significant progress has been made in:
Staff engagement has been central to this work, with colleagues actively contributing to:
EDI governance continues to be robust, with:
TSCG’s values of ambition, collaboration, inclusion, resilience and respect shaped how we worked, taught and led across the Group. These values underpin the EDI Strategy 2022–2025 by reinforcing a culture where fairness, inclusion and belonging are integral to decision-making and everyday practice. By living our values, we support our mission to unlock potential and transform lives, ensuring that opportunities for success are accessible to all, regardless of background.
The Board of Governors is proud to present the 2024–2025 EDI Annual Report, recognising the continued progress made across Trafford and Stockport College Group.
This year has demonstrated a strong commitment to embedding inclusion across all areas of the organisation. We have seen:
The Board recognises that staff are central to delivering inclusive education, and we are particularly encouraged by the progress made in:
We remain committed to ensuring that EDI continues to be a strategic priority, supporting both staff and students to succeed.
Over the past year, TSCG has continued our work to reduce attainment gaps between different student groups. In partnership with stakeholders and industry experts, we remain committed to our ambition that no attainment gap exceeds three percentage points. To support this objective, TSCG has focused on identifying the key barriers to student success—including accessibility, health and financial challenges—and implementing strategies to minimise their impact on learners’ success. Through engagement with an external consultant to support the development of our Further Education Access and Participation Plan, we now have a clear and targeted action plan designed to address gaps in achievement and ensure all learners have an equal opportunity to succeed.
Of the 22 student categories TSCG monitor (covering Young People, Adults and Apprenticeship provision), nine categories currently show an attainment gap of three or more percentage points, consistent with the position in 2023/24. Encouragingly, among the programmes that previously exceeded the three-point threshold, progress has been made in reducing the gap in three areas. For those programmes where gaps remain above target, we have set specific improvement targets, implemented focused actions, and established review points—supported by insight from industry experts and stakeholders—to deepen our understanding of the underlying causes and to work collaboratively to remove barriers to success.
Achievement levels for learners with EHCPs and those with High Needs continue to be a significant consideration when assessing overall organisational outcomes. Following recent significant rises in the number of EHCP and High Needs learners across TSCG, these areas influence the broader achievement landscape and highlight where targeted support remains important. Despite this, overall progress is moving in a positive direction, reflecting our sustained commitment to ensuring every learner has the opportunity to succeed.
Achievement Gaps that have Narrowed in 2024–2025:
In addition to monitoring attainment gaps across protected characteristics, the college also tracks several priority groups, including learners from deprived postcode areas and those in receipt of free college meals. Encouragingly, attainment gaps across these priority groups remain below our target of 3 percentage points. We have also seen an improvement in our overall attainment baseline, with rates now exceeding 86%, bringing these outcomes in line with wider college performance.
Achievement Gaps 2024–2025:
Male apprentices represent 64.9%, while females represent 35.1%.
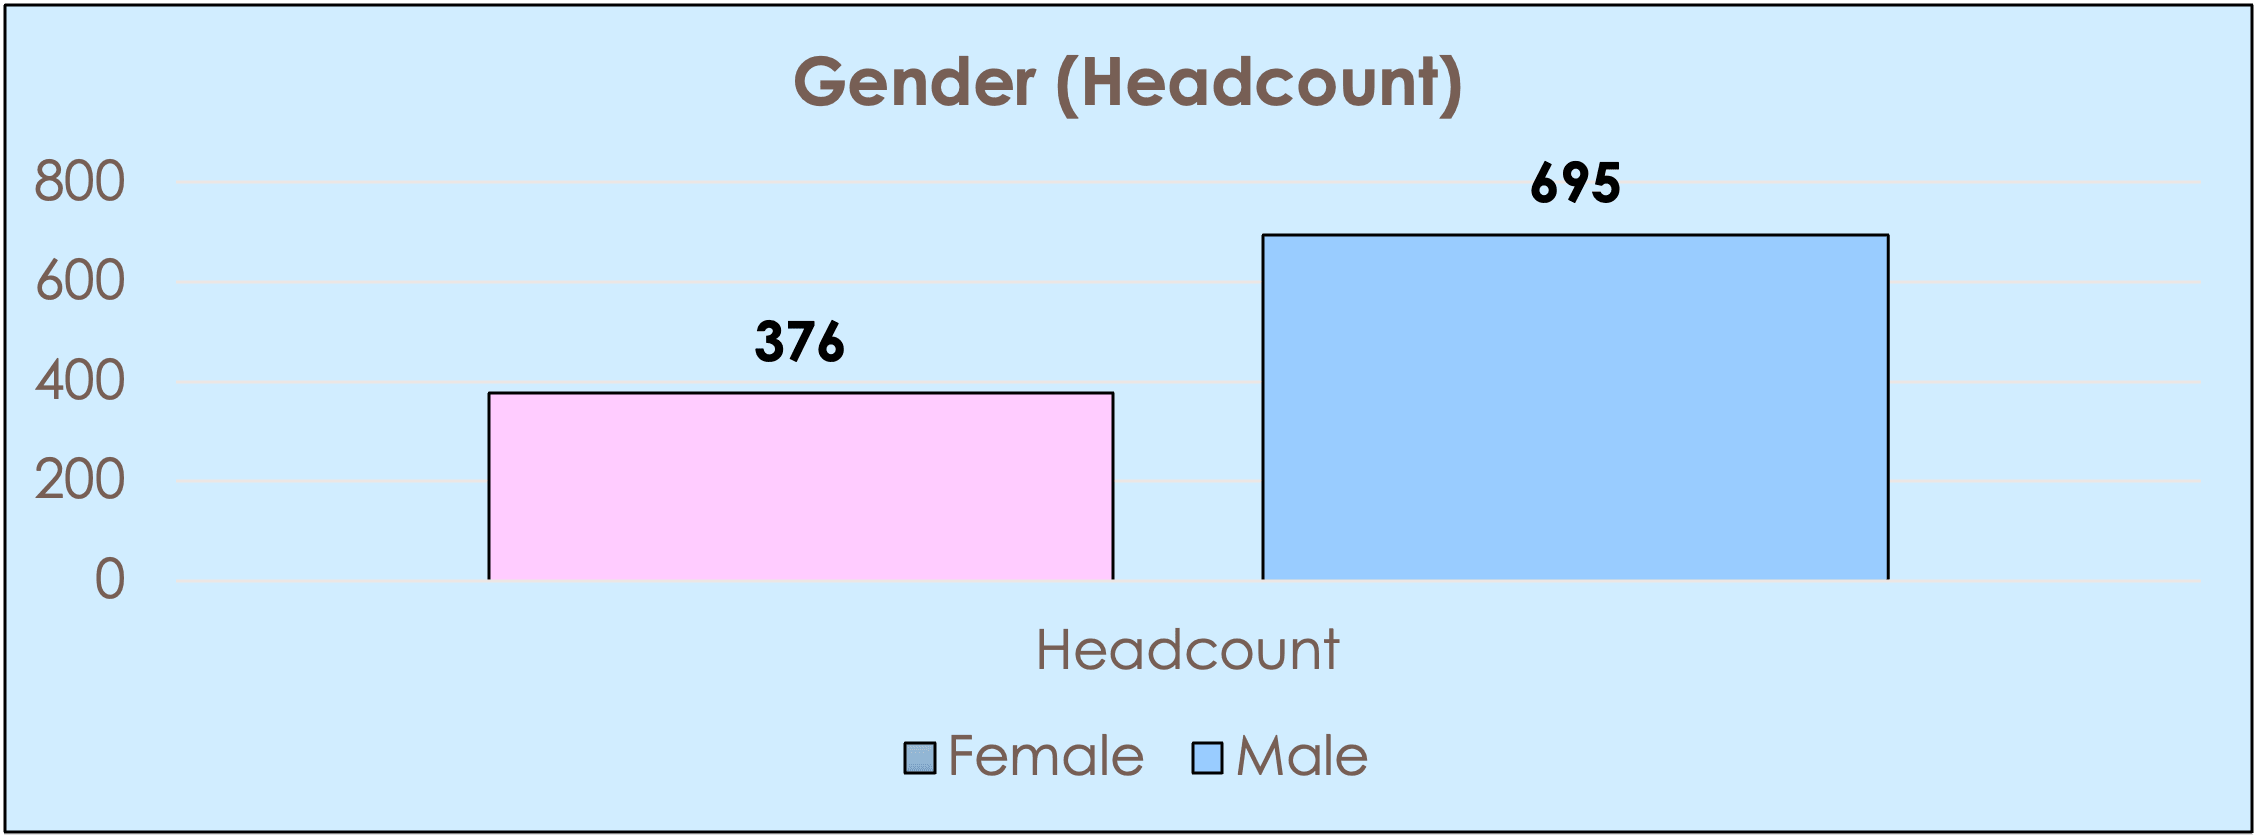
| Gender | Headcount |
|---|---|
| Female | 376 |
| Male | 695 |
Most apprentices are aged 19+ (72.1%), while 28.1% are 16–18.
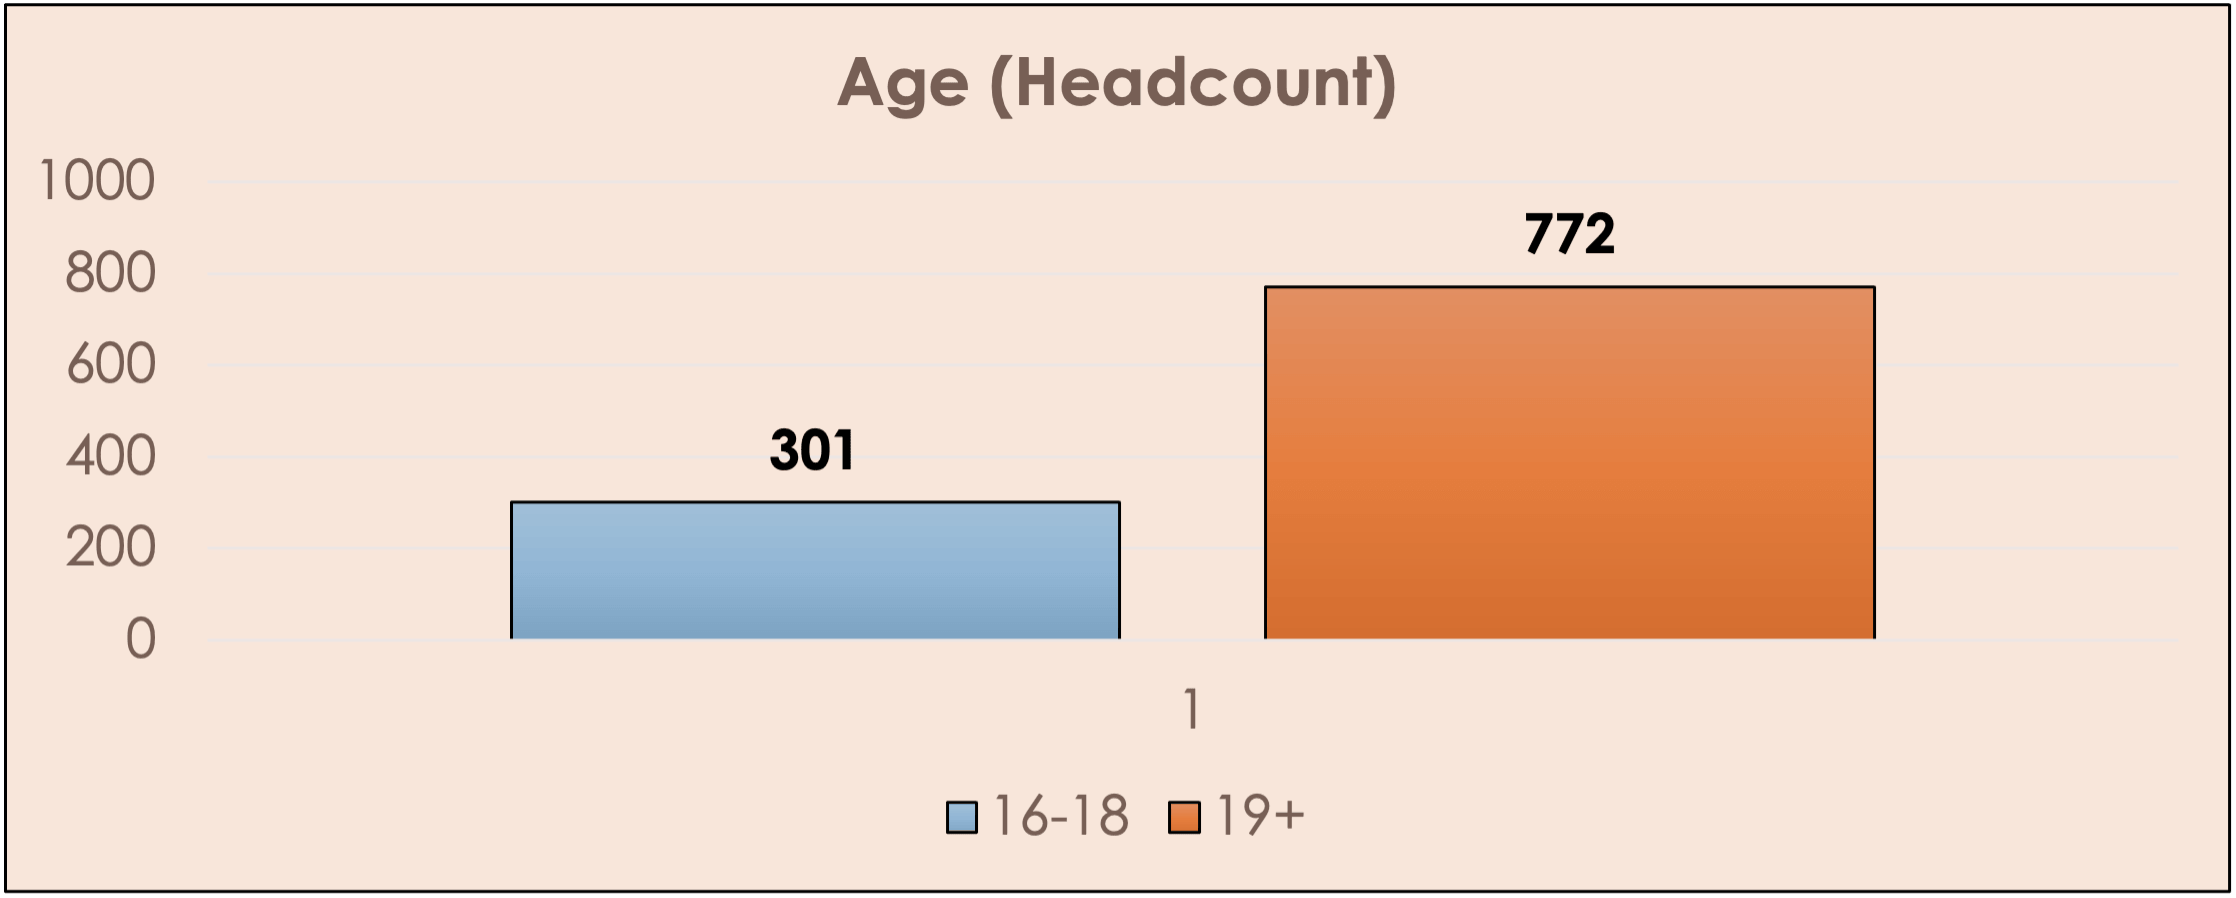
| Age Group | Headcount |
|---|---|
| 16–18 | 301 |
| 19+ | 772 |
7.38% of apprentices declared a disability.
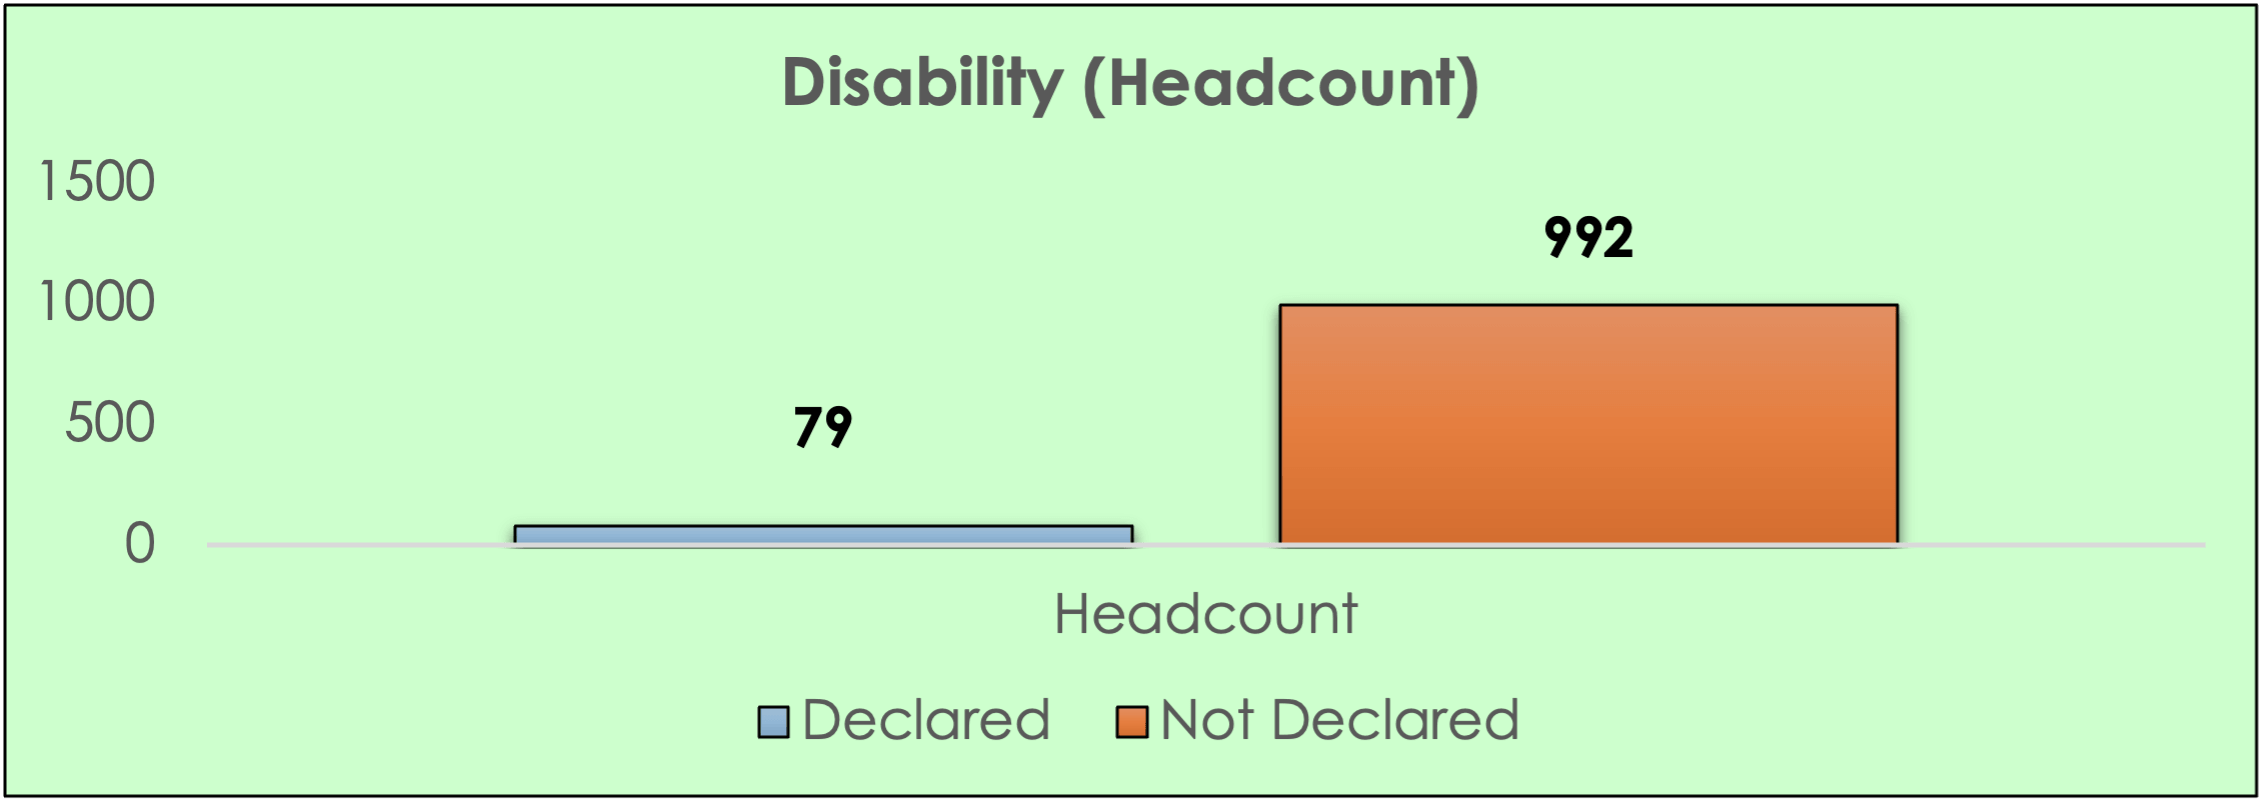
| Disability Status | Headcount |
|---|---|
| Declared | 79 |
| Not Declared | 992 |
The ethnicity of White British is 85.8%.
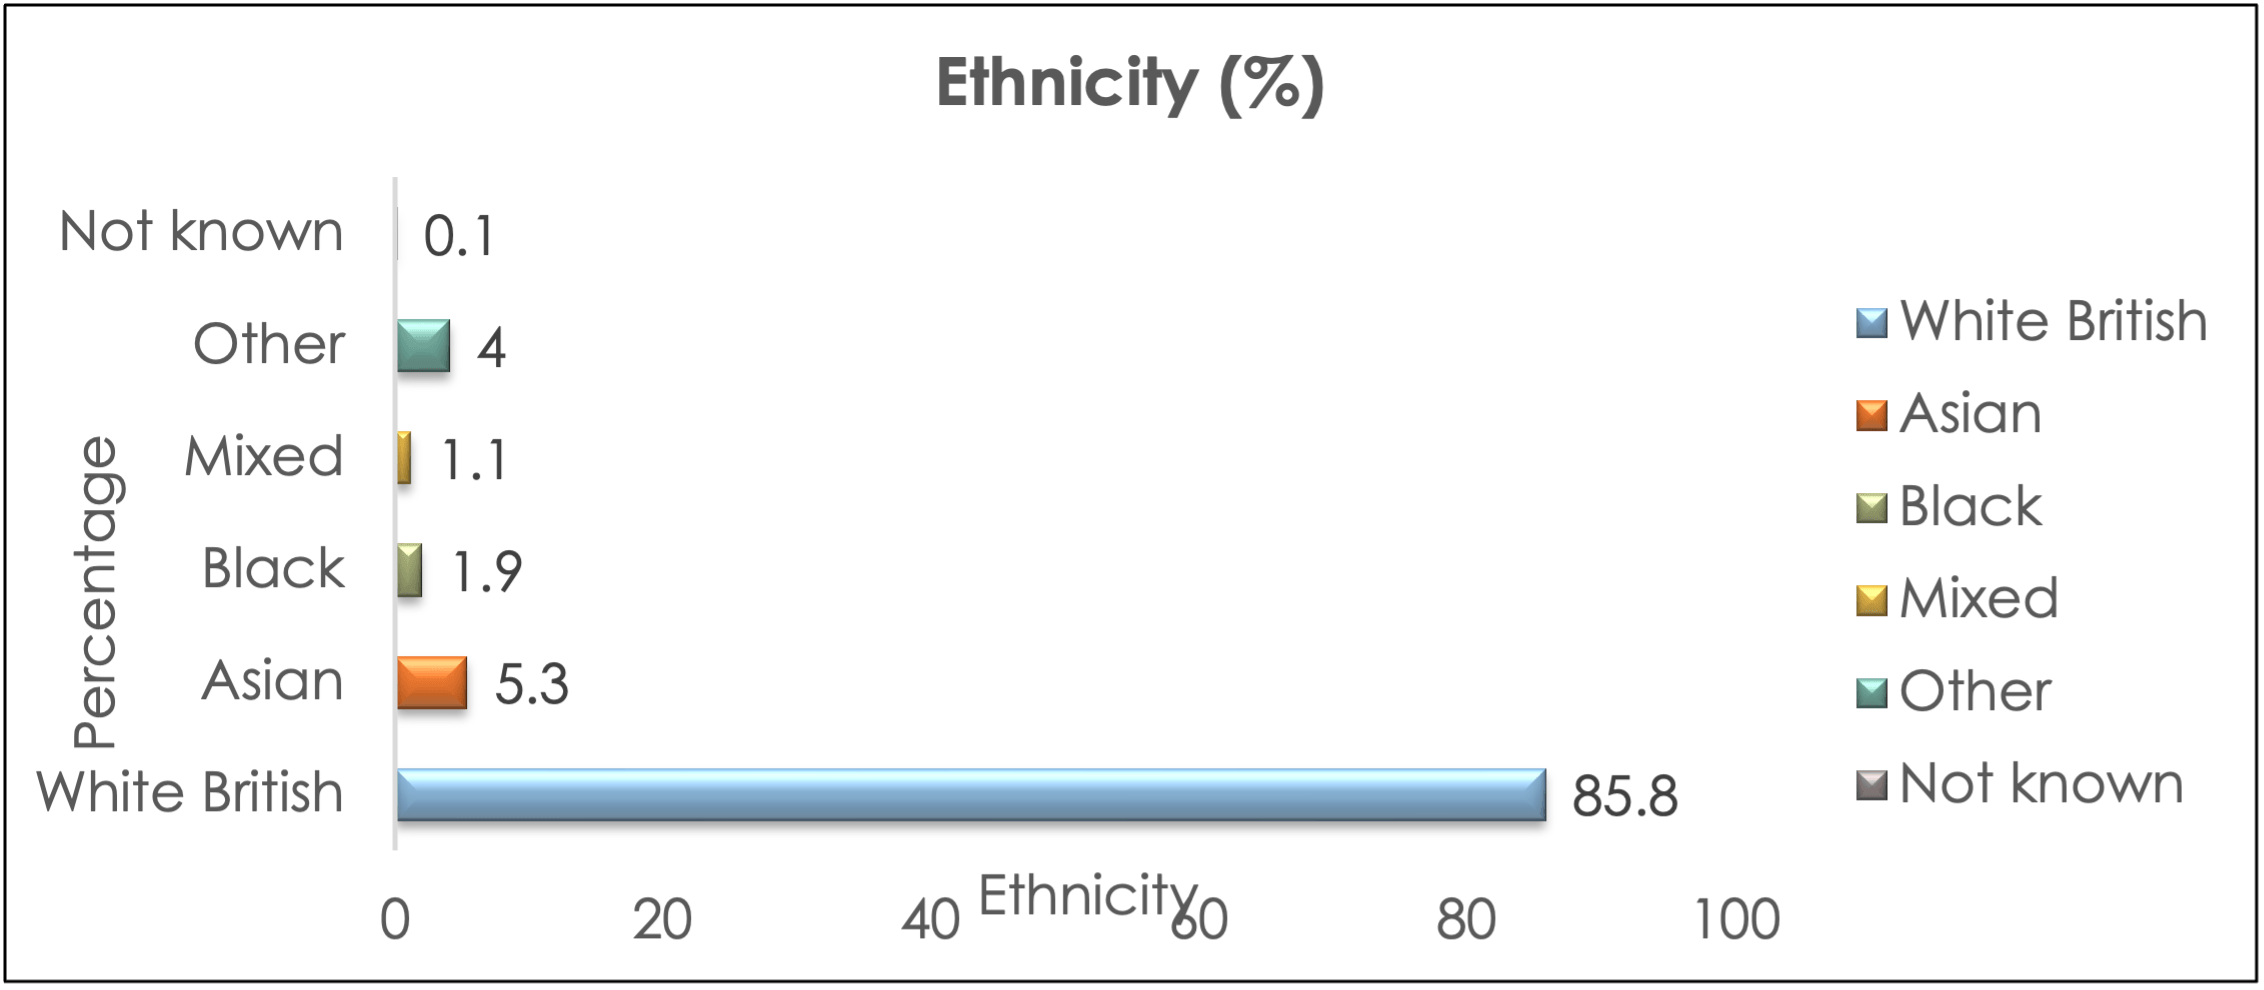
| Ethnicity | Percentage |
|---|---|
| White British | 85.8% |
| Asian | 5.3% |
| Black | 1.9% |
| Mixed | 1.1% |
| Other | 4.0% |
| Not known | 0.1% |
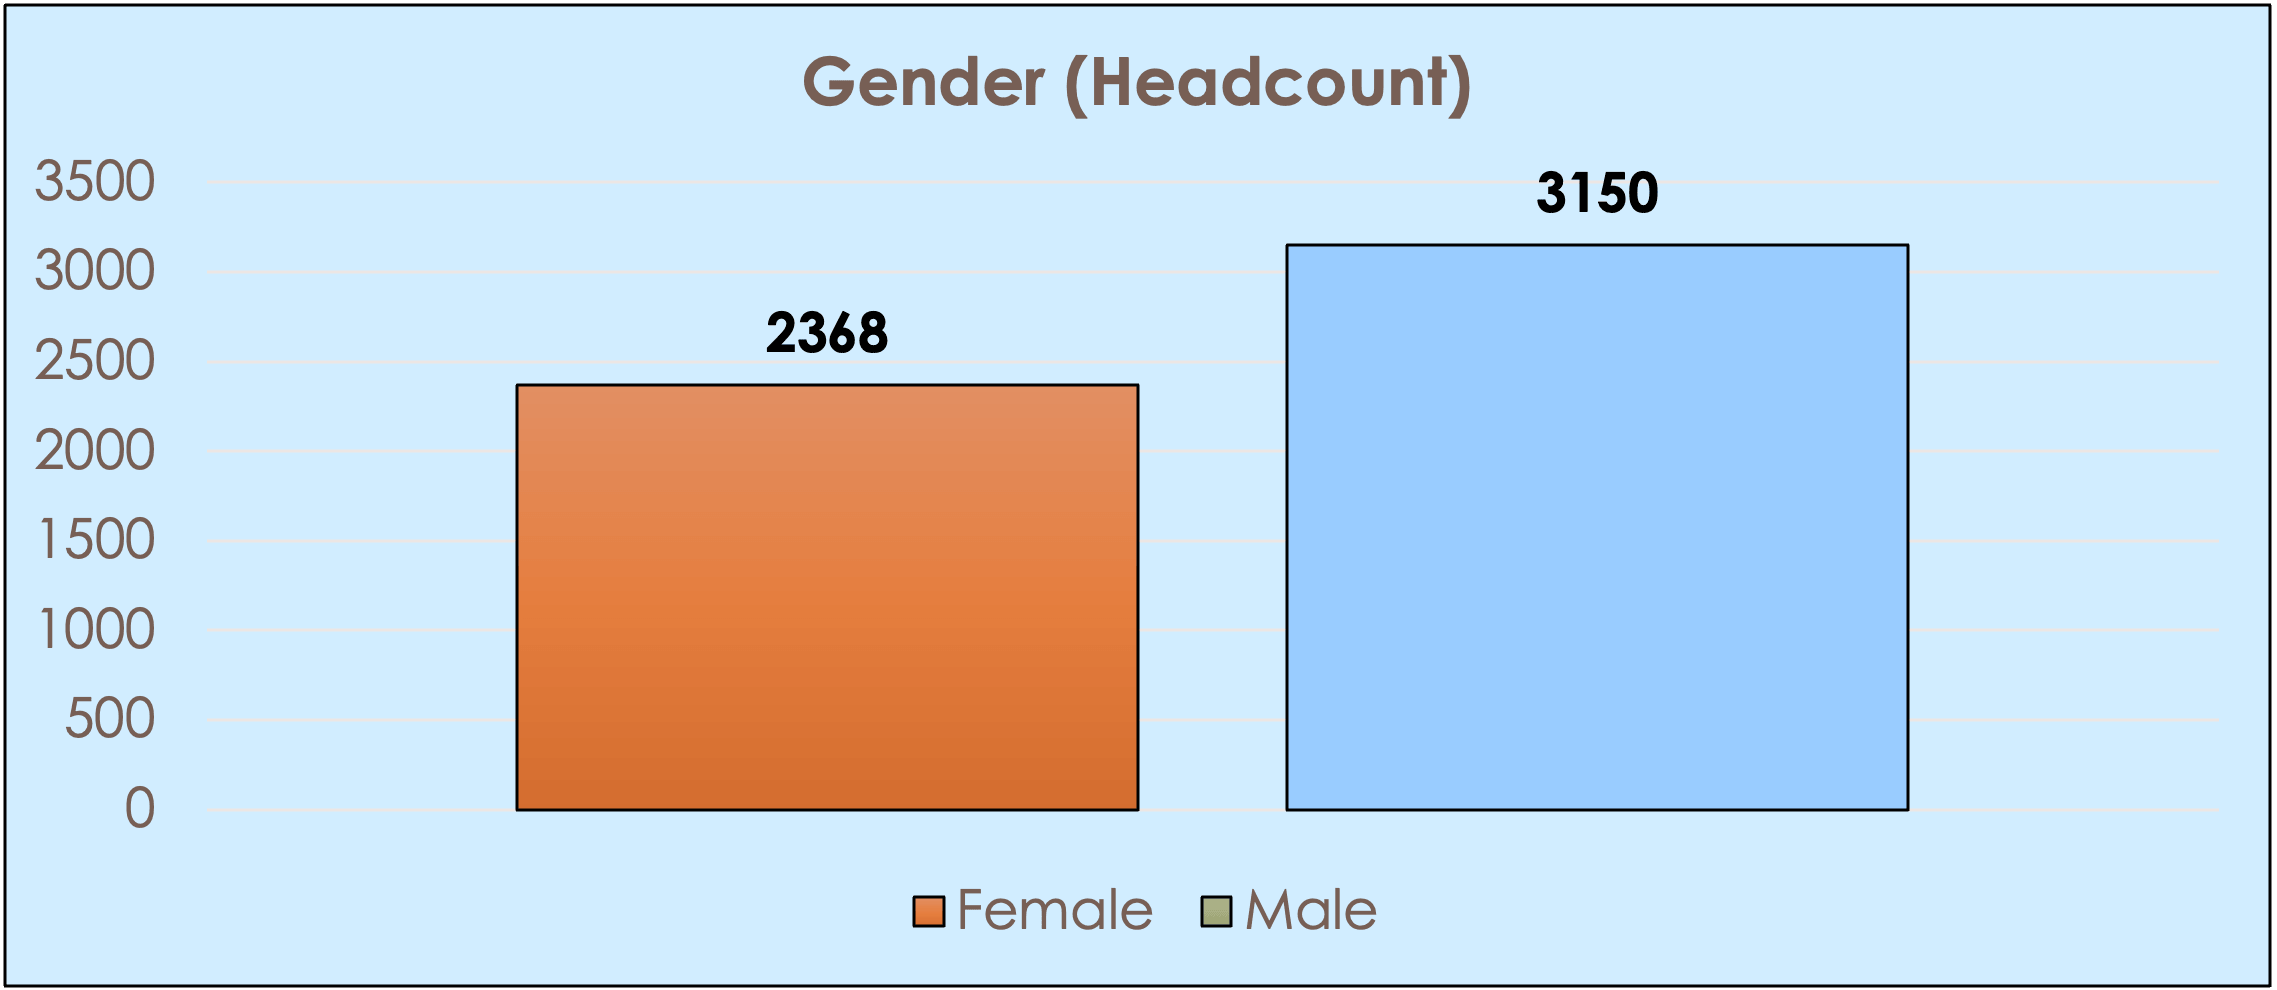
Young People learners are 57.1% male and 42.9% female.
| Gender | Headcount |
|---|---|
| Female | 2,368 |
| Male | 3,150 |
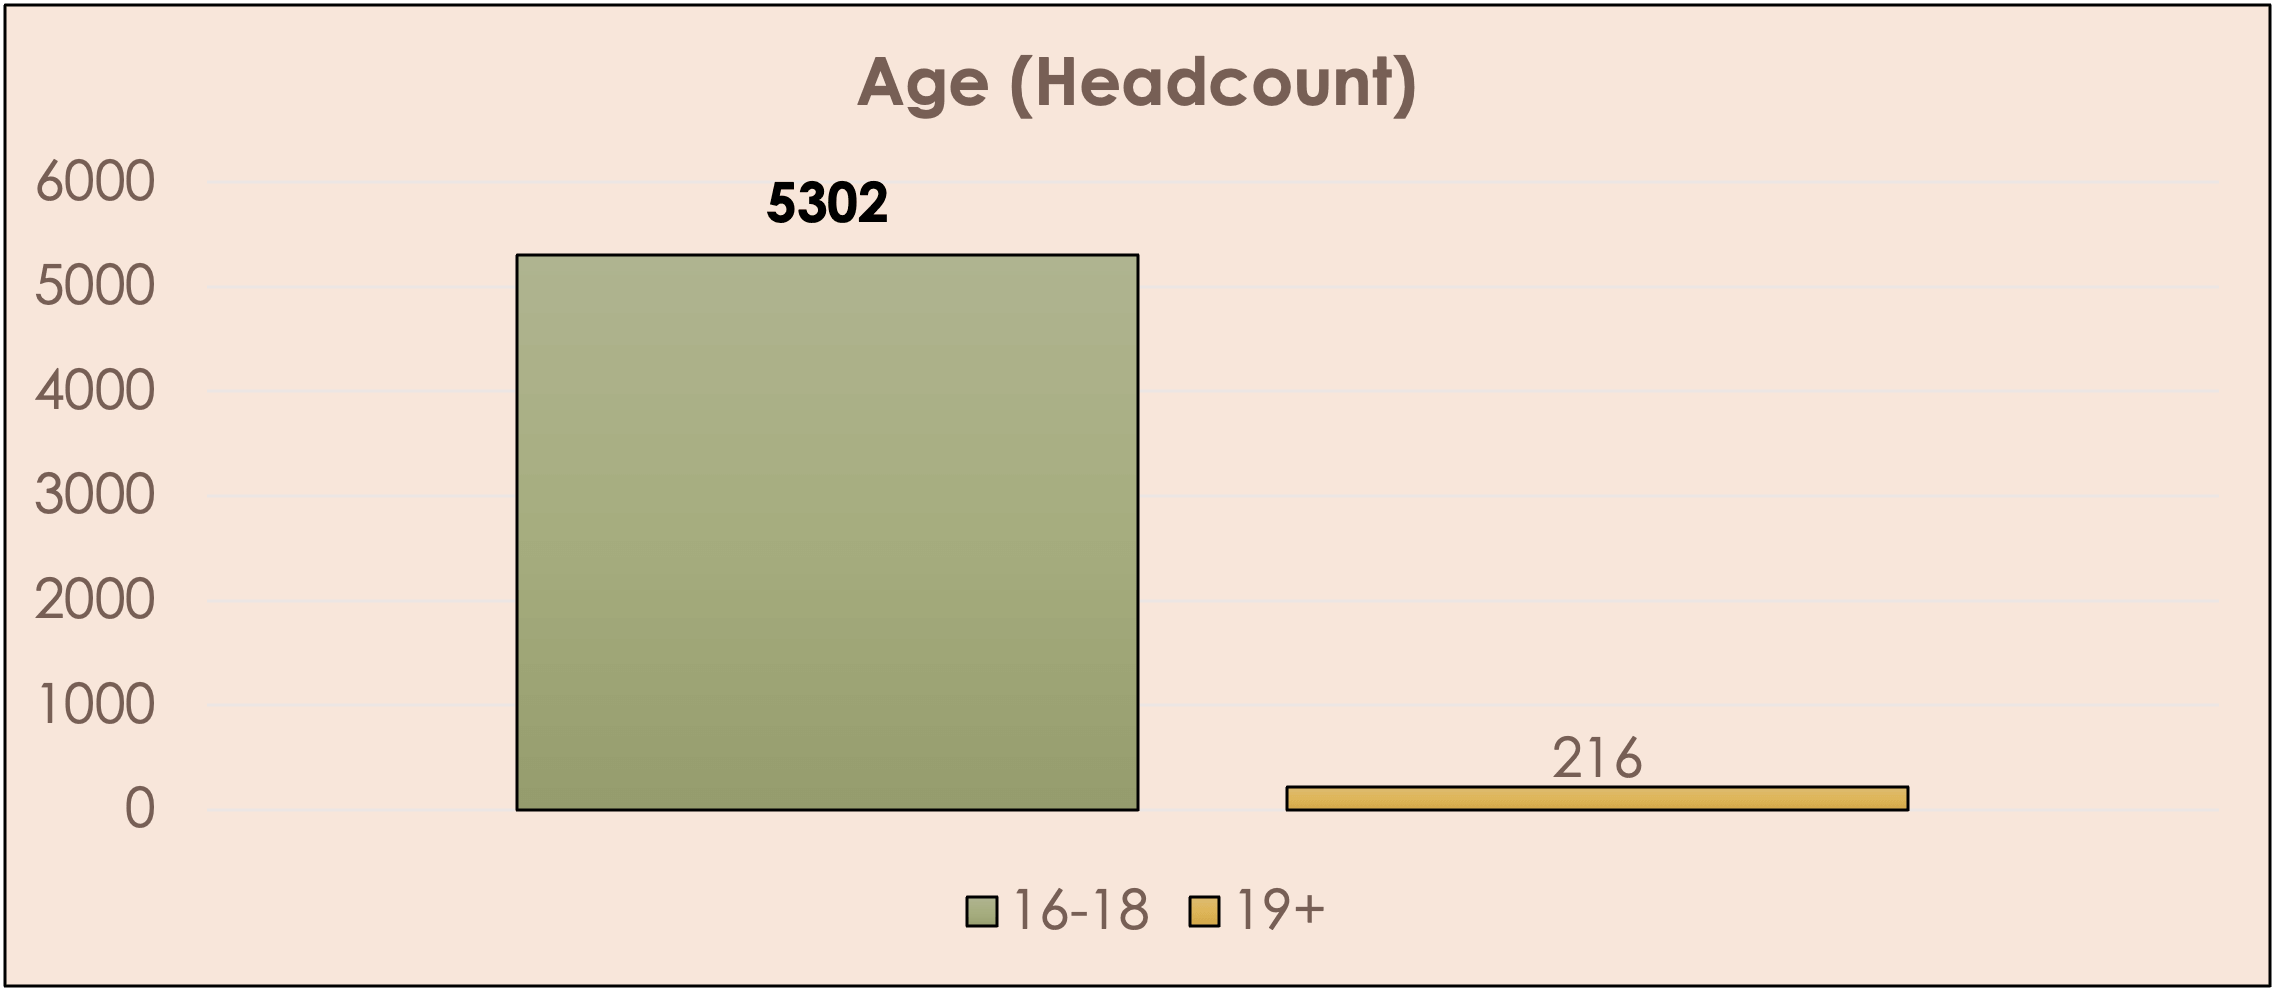
The majority (96.1%) are aged 16–18.
| Age Group | Headcount |
|---|---|
| 16–18 | 5,302 |
| 19+ | 216 |
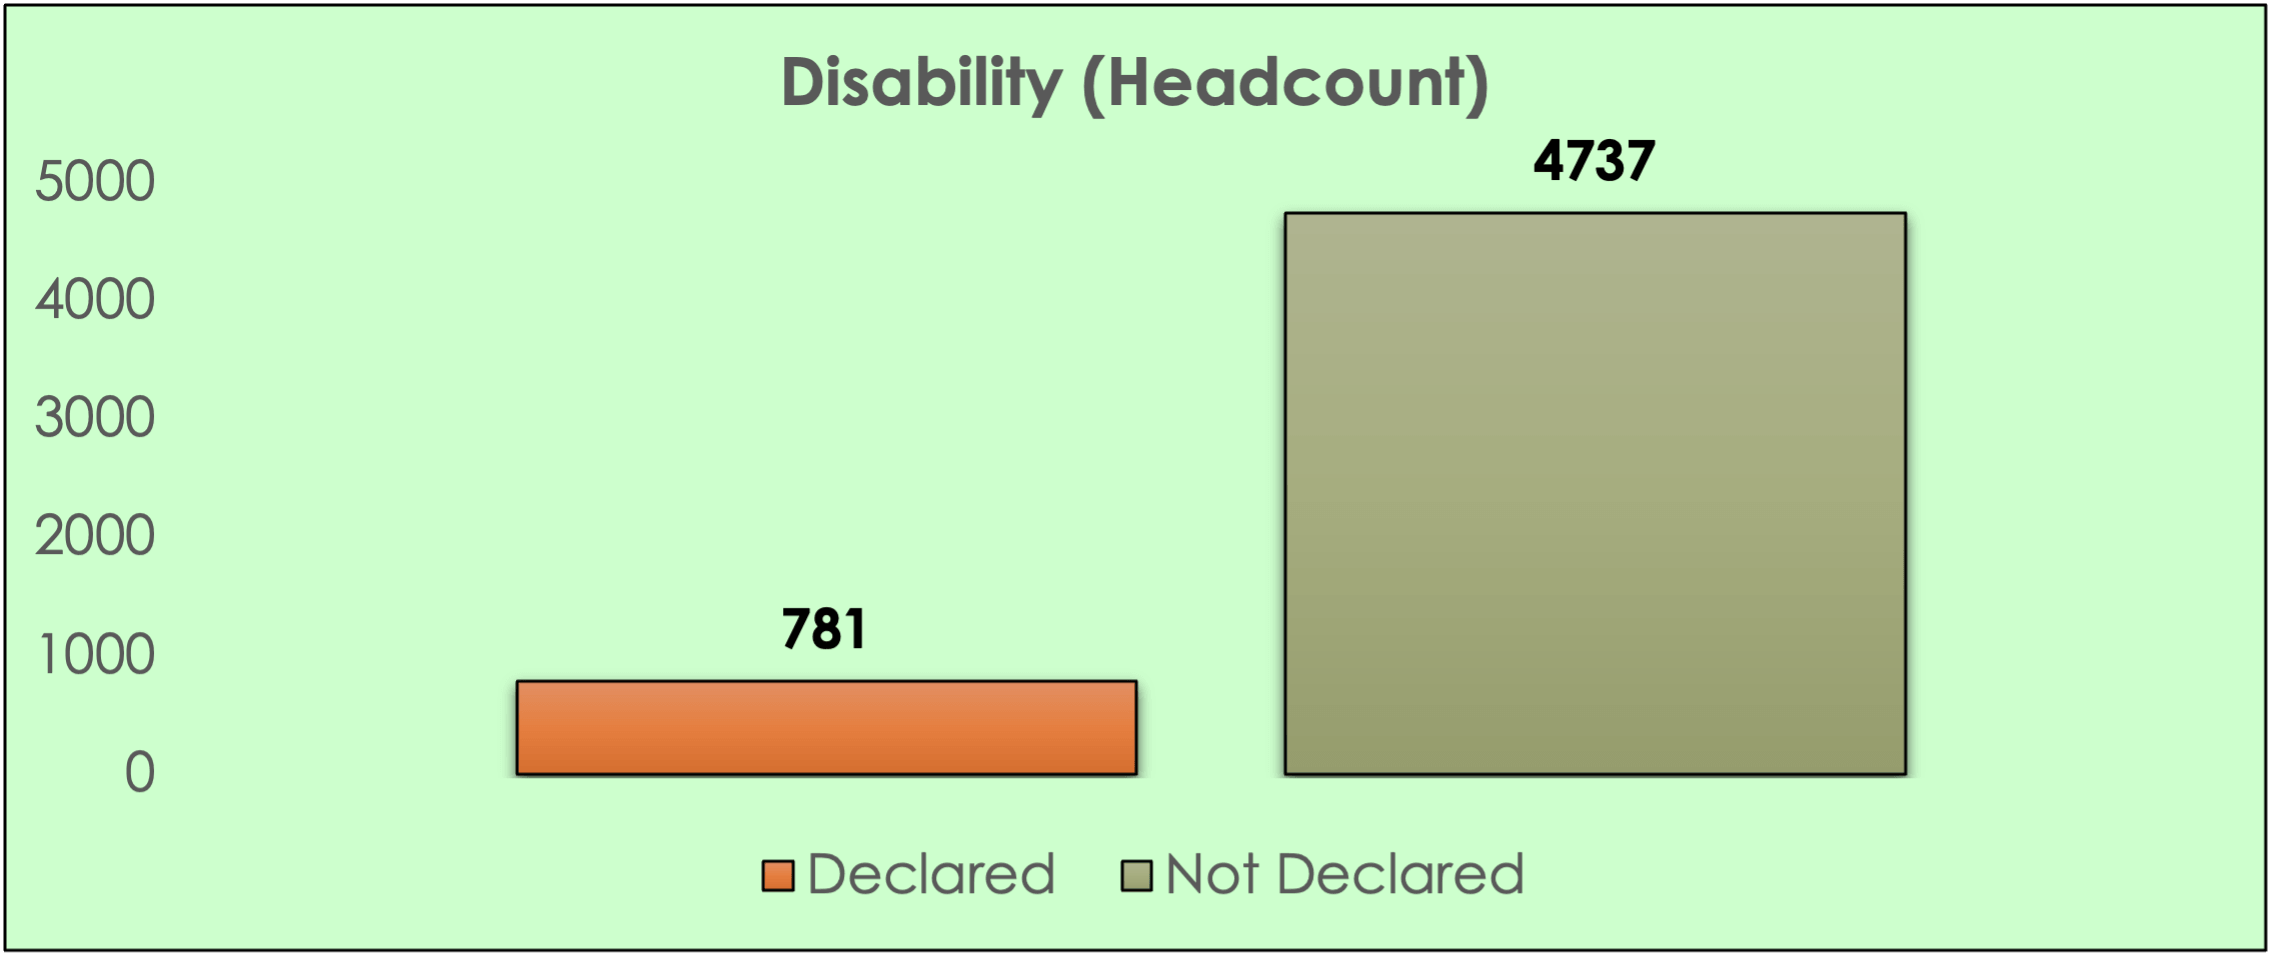
14.15% have declared a disability and 85.85% have not known to have a disability.
| Disability Status | Headcount |
|---|---|
| Declared | 781 |
| Not Declared | 4,737 |
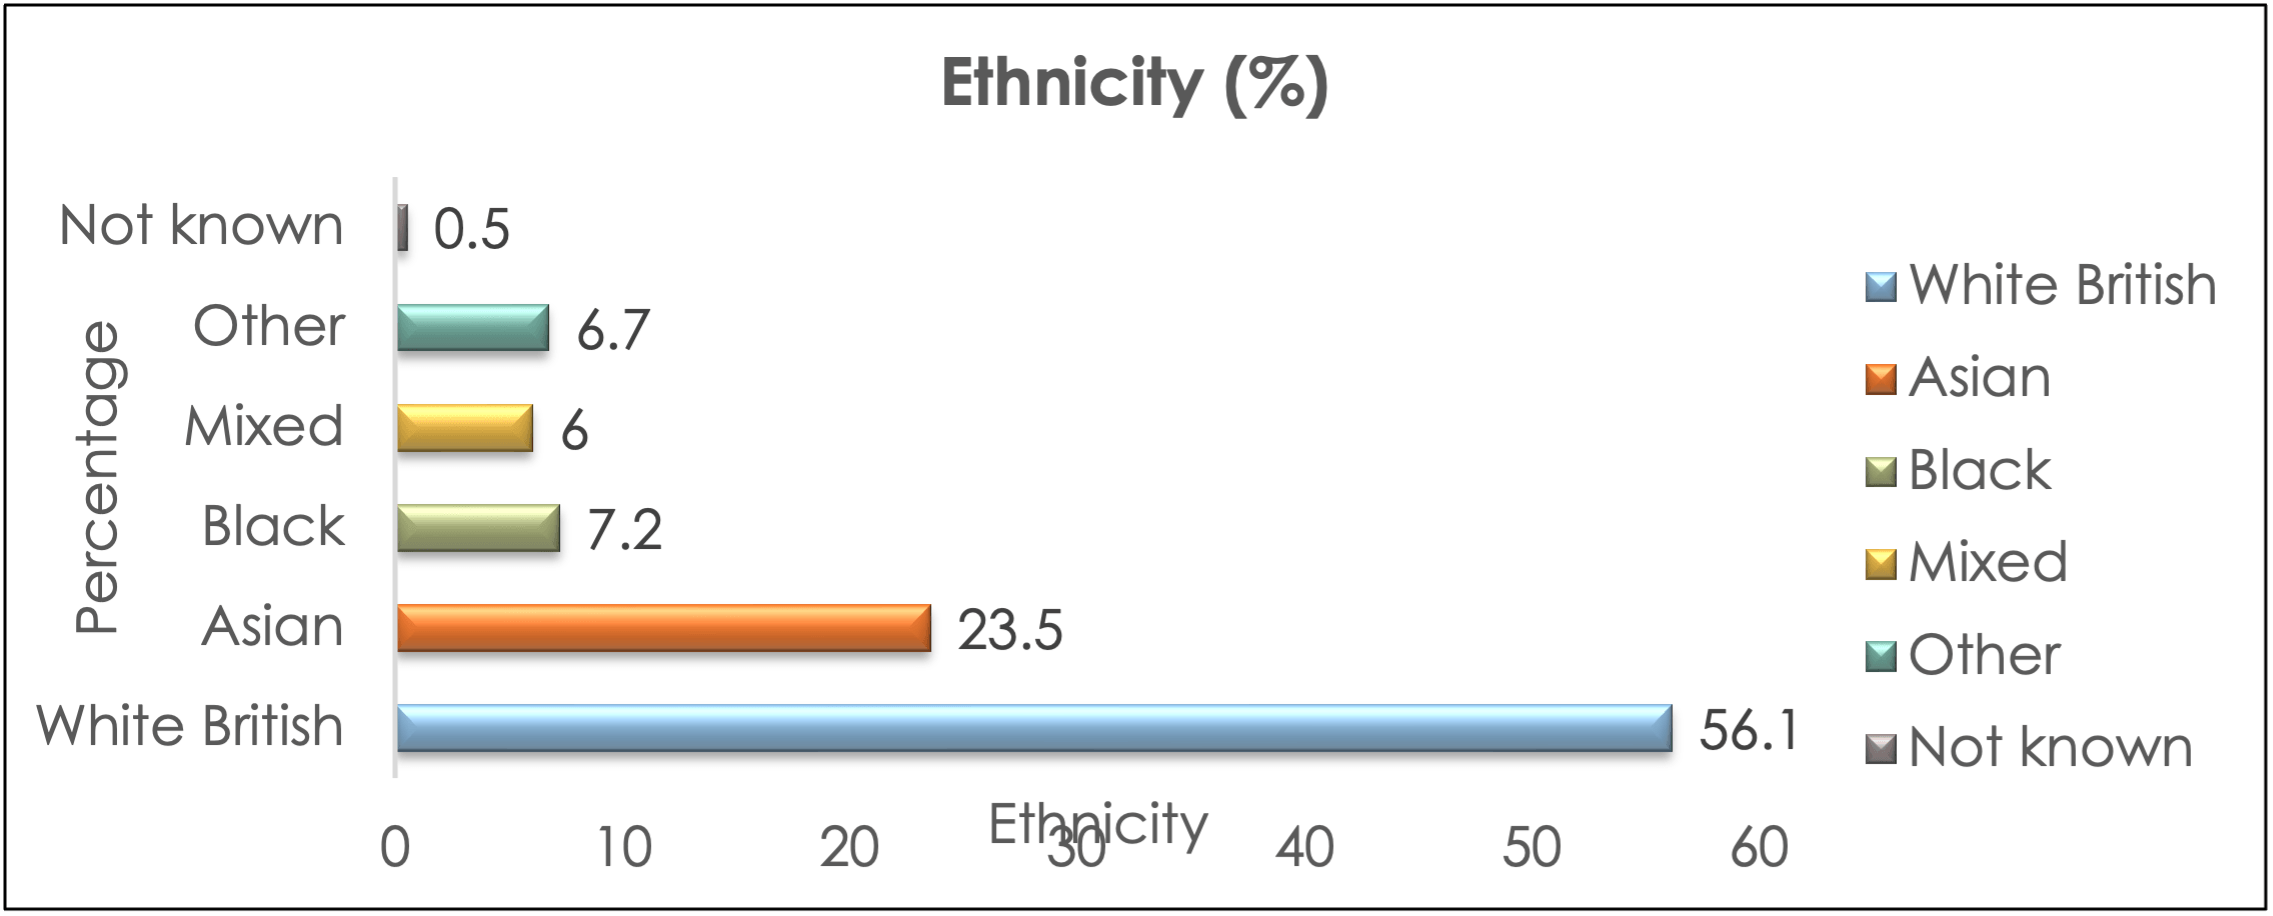
Over half are White British (56.1%), with high representation from Pakistani (11.5%) and African (7.3%) backgrounds.
| Ethnicity | Percentage |
|---|---|
| White British | 56.1% |
| Asian | 23.5% |
| Black | 7.2% |
| Mixed | 6.0% |
| Other | 6.7% |
| Not known | 0.5% |
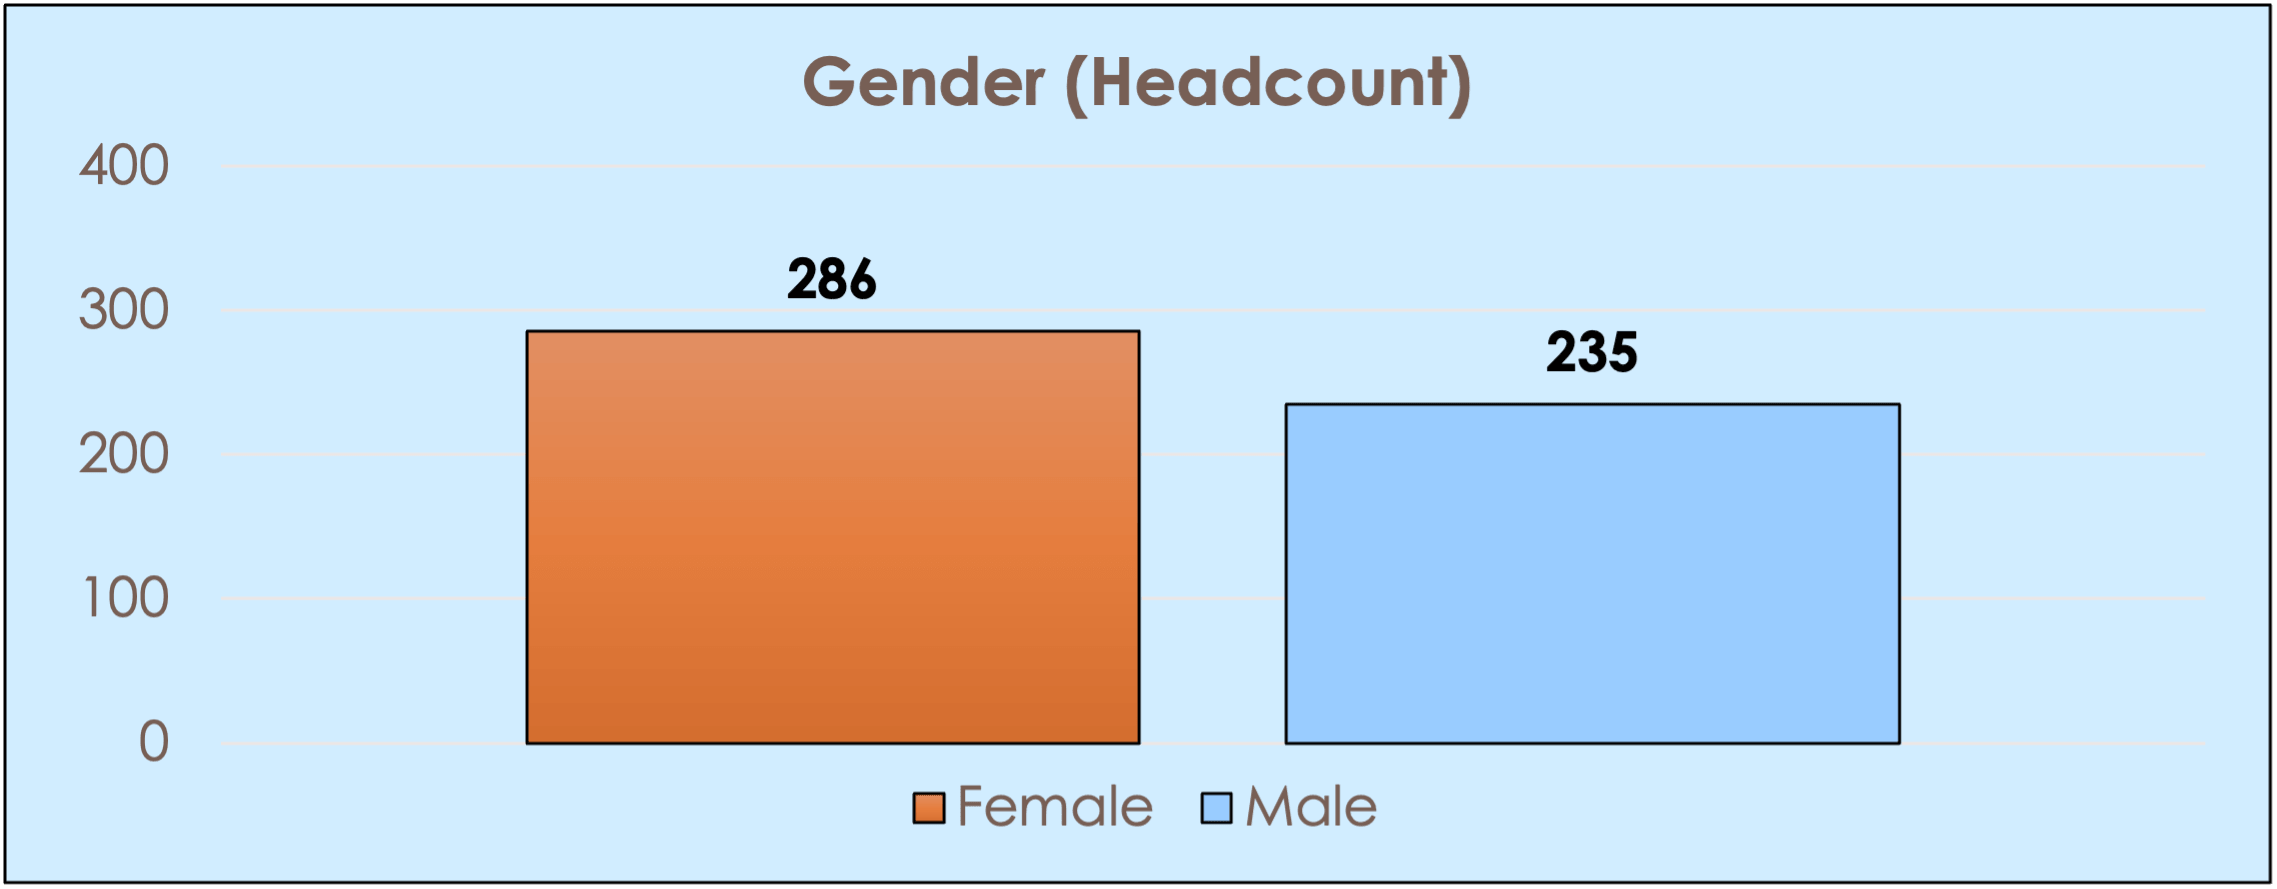
HE learners comprise 54.9% female and 45.1% male.
| Gender | Headcount |
|---|---|
| Female | 286 |
| Male | 235 |
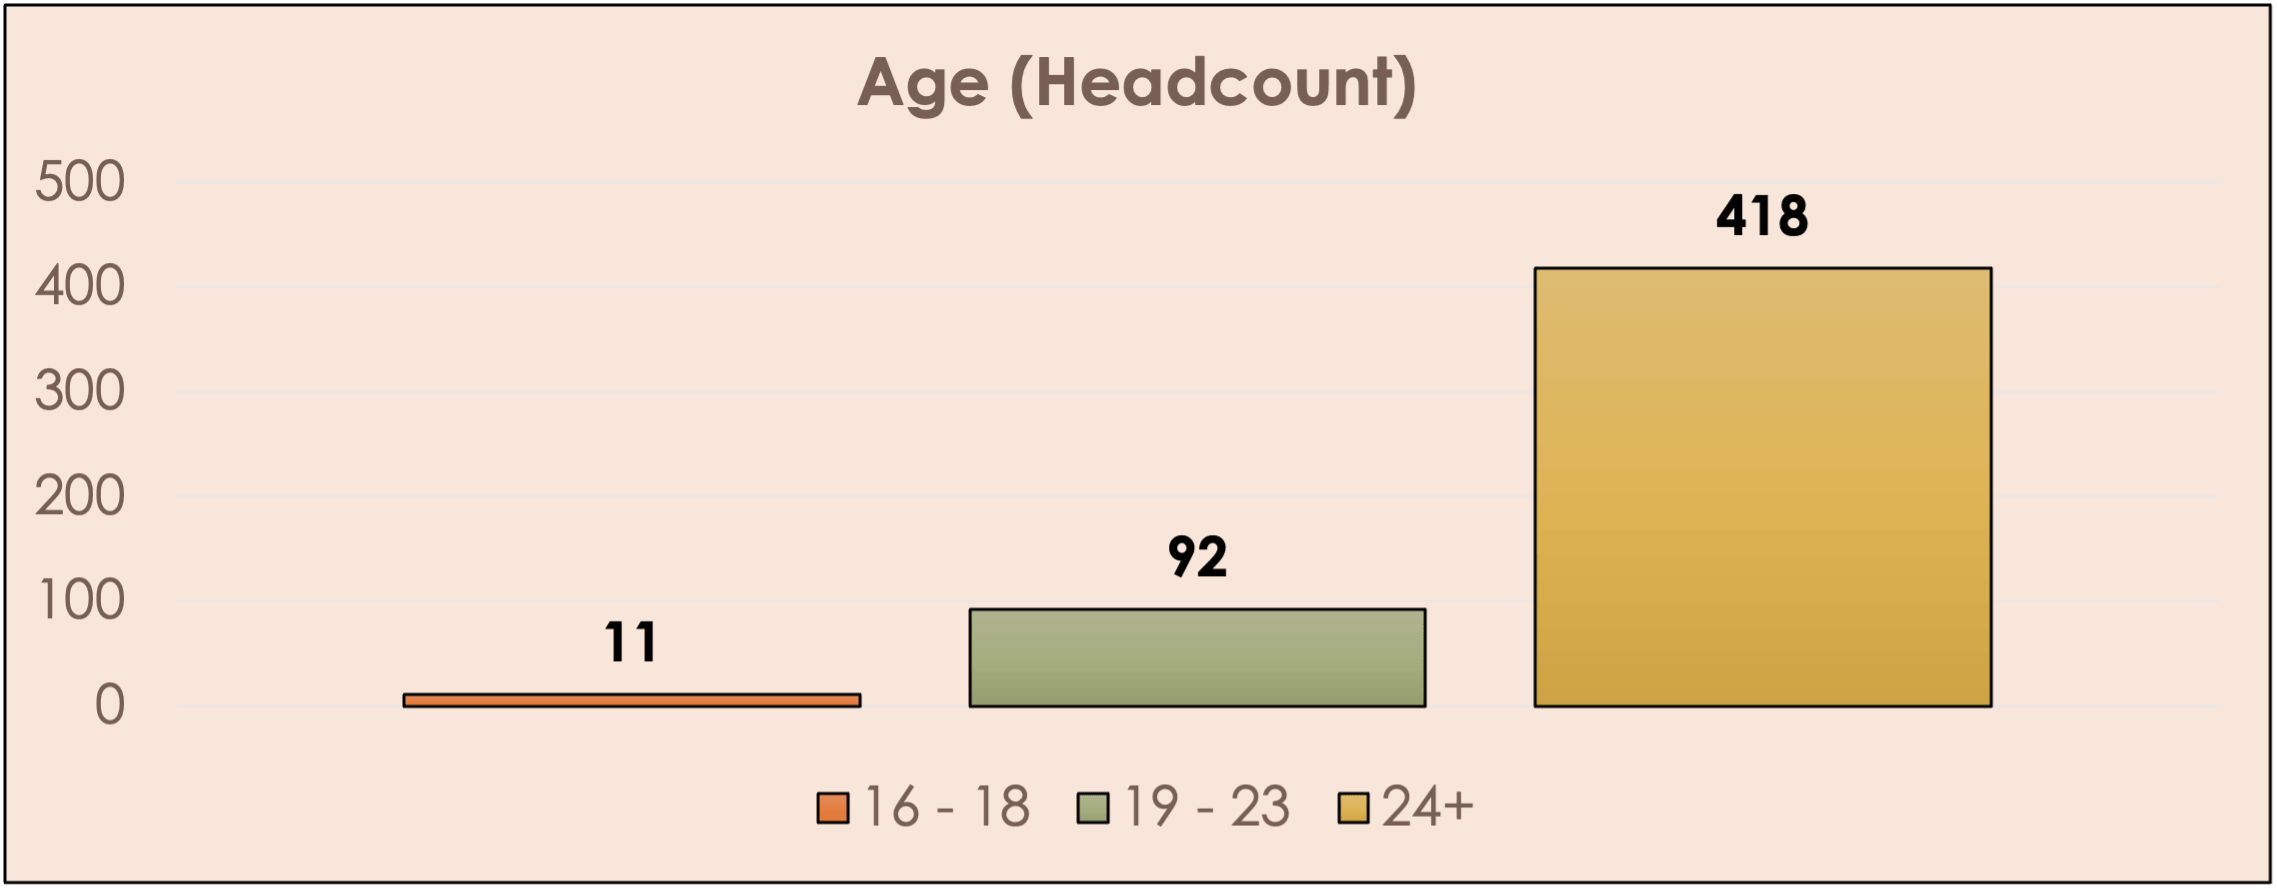
Most HE learners are 24+ (80.2%), with lower proportions aged 19–23 (17.7%) and 16–18 (2.1%).
| Age Group | Headcount |
|---|---|
| 16–18 | 11 |
| 19–23 | 92 |
| 24+ | 418 |
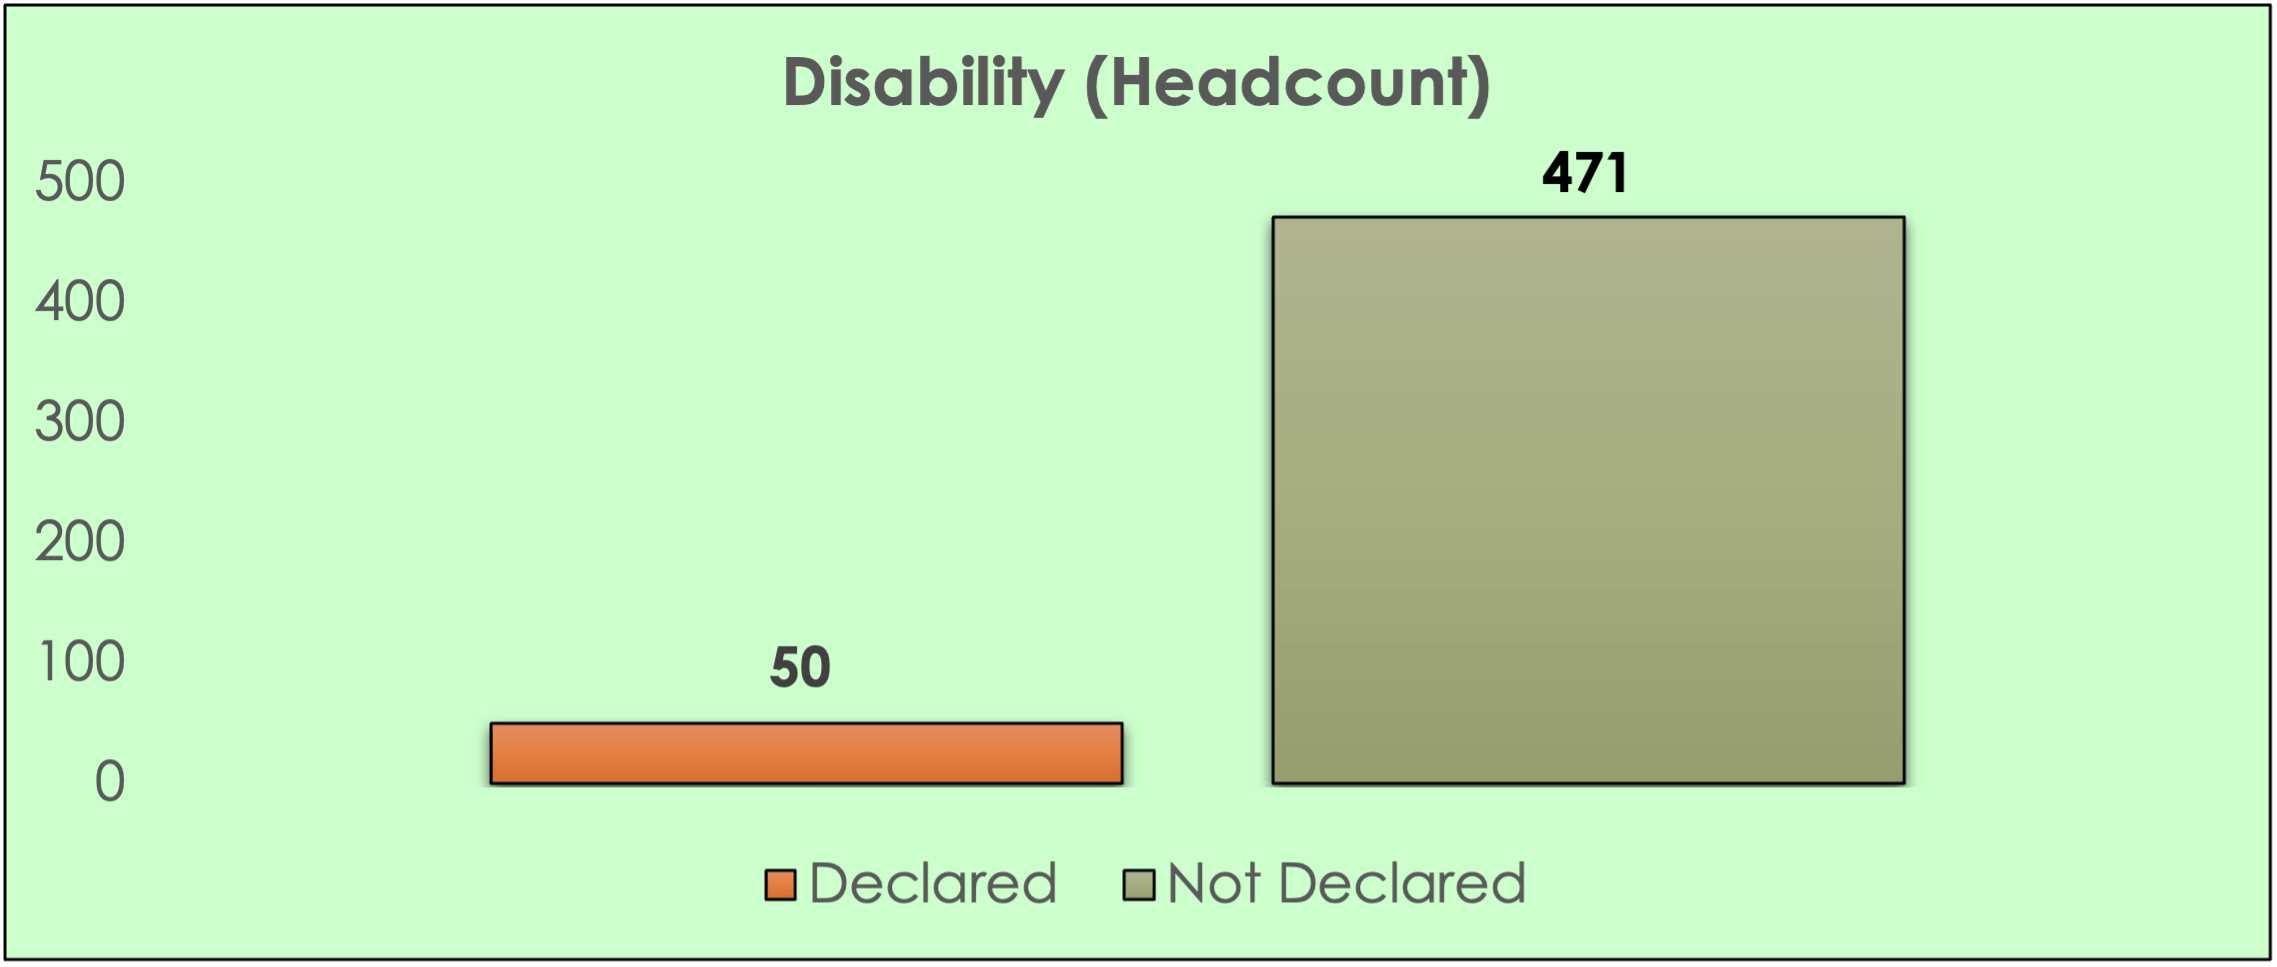
9.60% have declared a disability and 90.4% are not known to have a disability.
| Disability Status | Headcount |
|---|---|
| Declared | 50 |
| Not Declared | 471 |
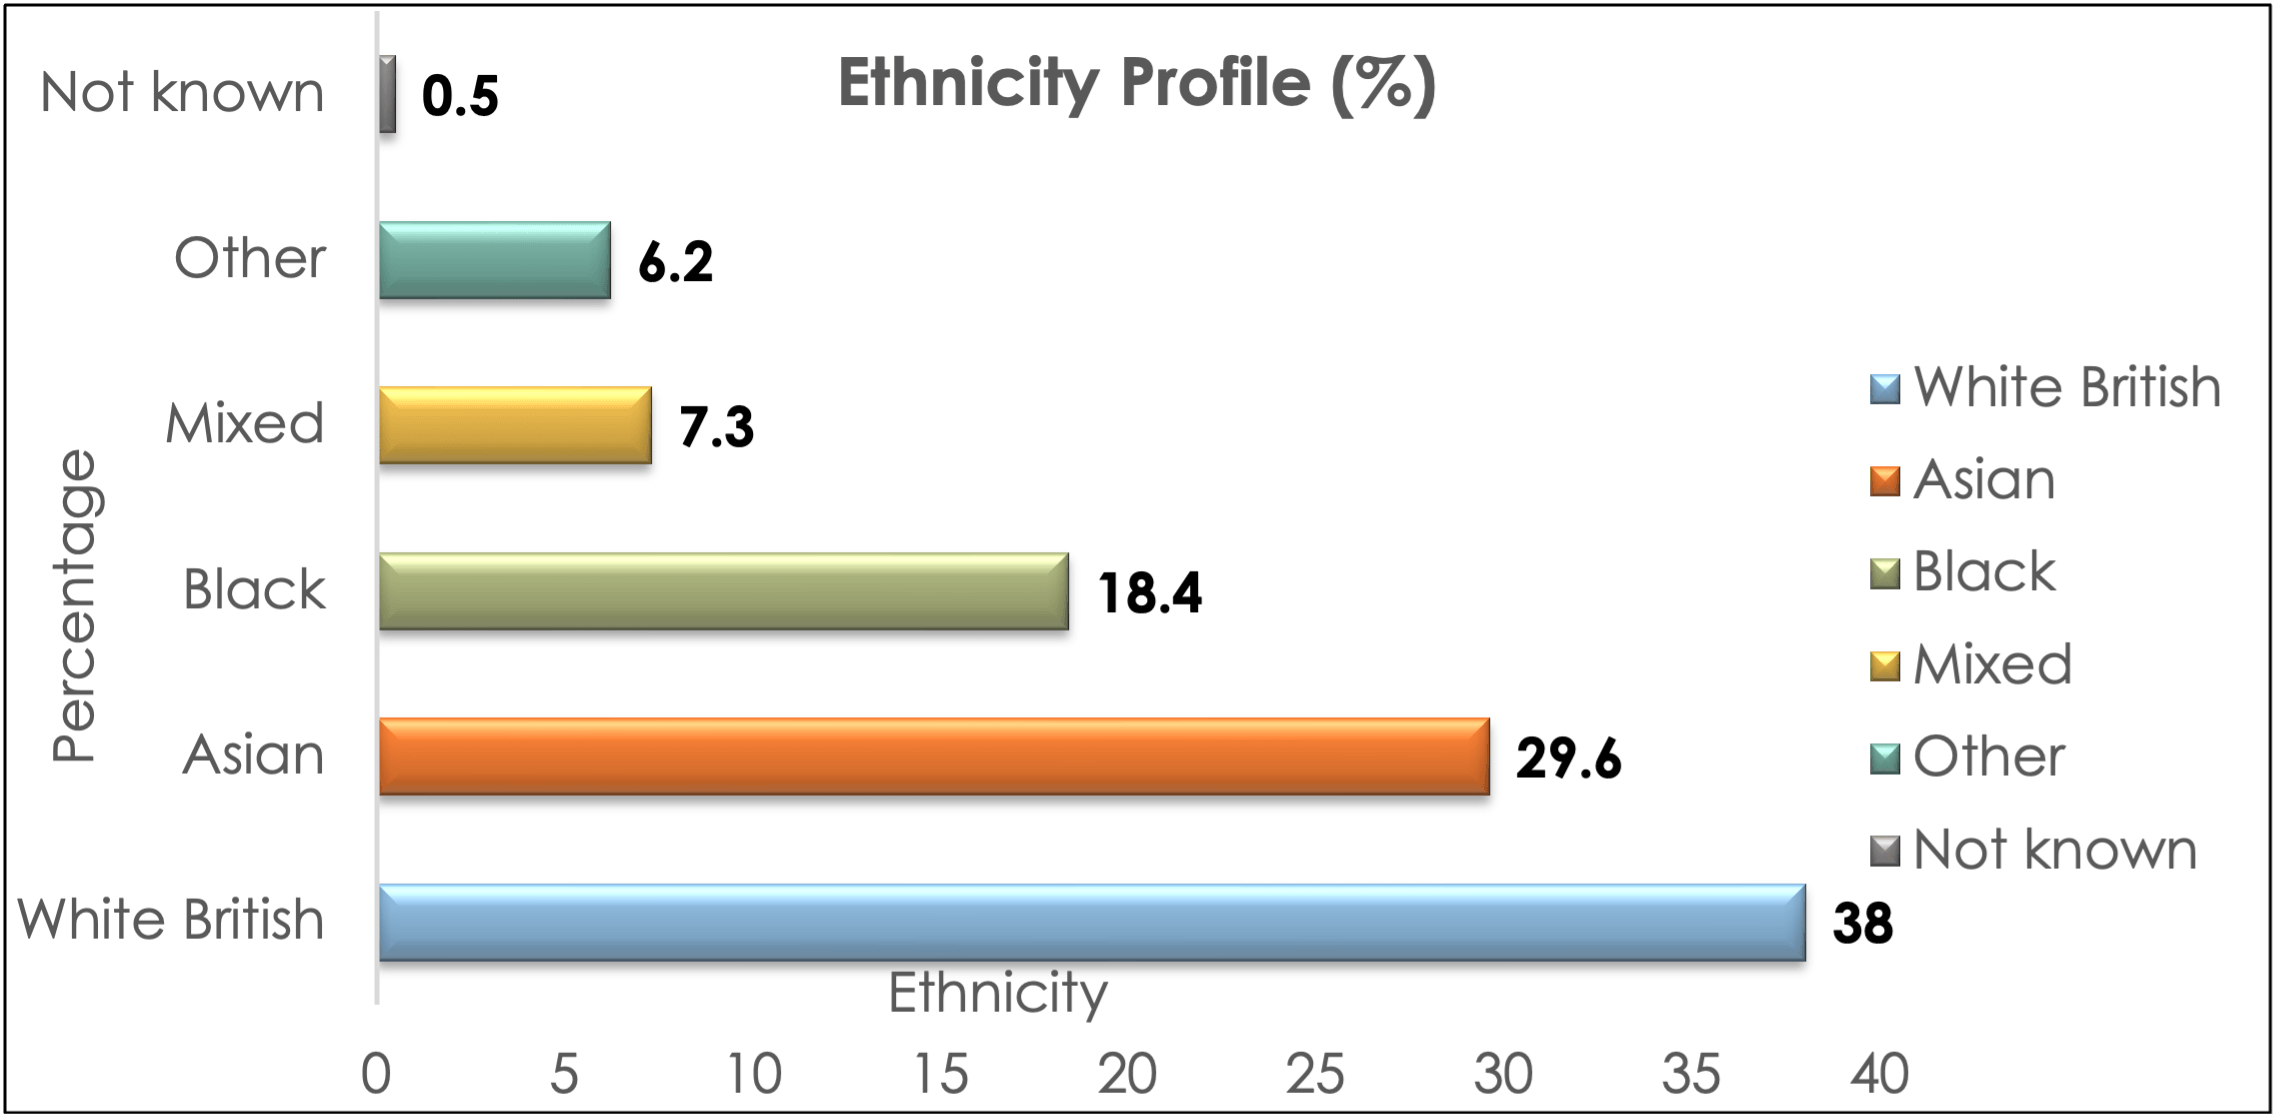
HE group is diverse: 38% White British and notable groups include African (12.67%) and Bangladeshi (12.67%).
| Ethnicity | Percentage |
|---|---|
| White British | 38.0% |
| Asian | 29.6% |
| Black | 18.4% |
| Mixed | 7.3% |
| Other | 6.2% |
| Not known | 0.5% |
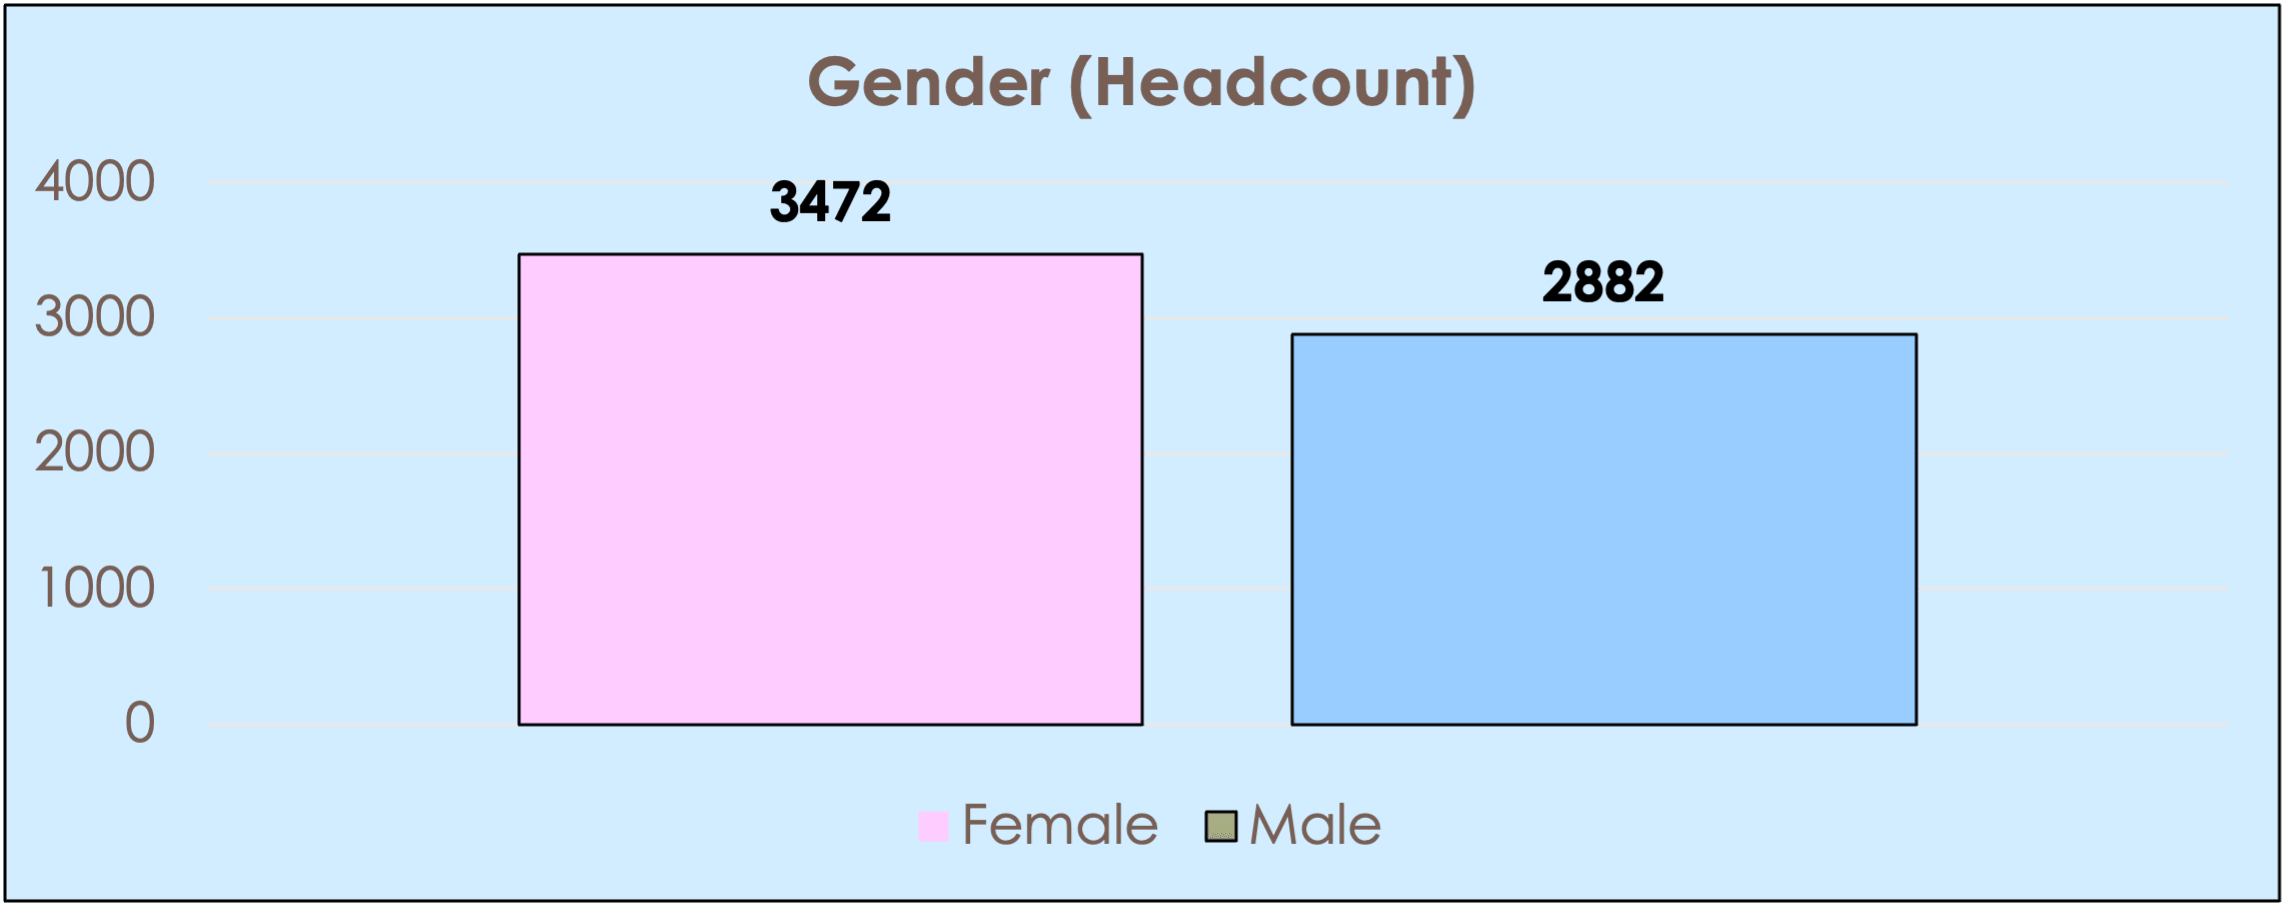
Adult learners are 54.6% female and 45.4% male.
| Gender | Headcount |
|---|---|
| Female | 3,472 |
| Male | 2,882 |
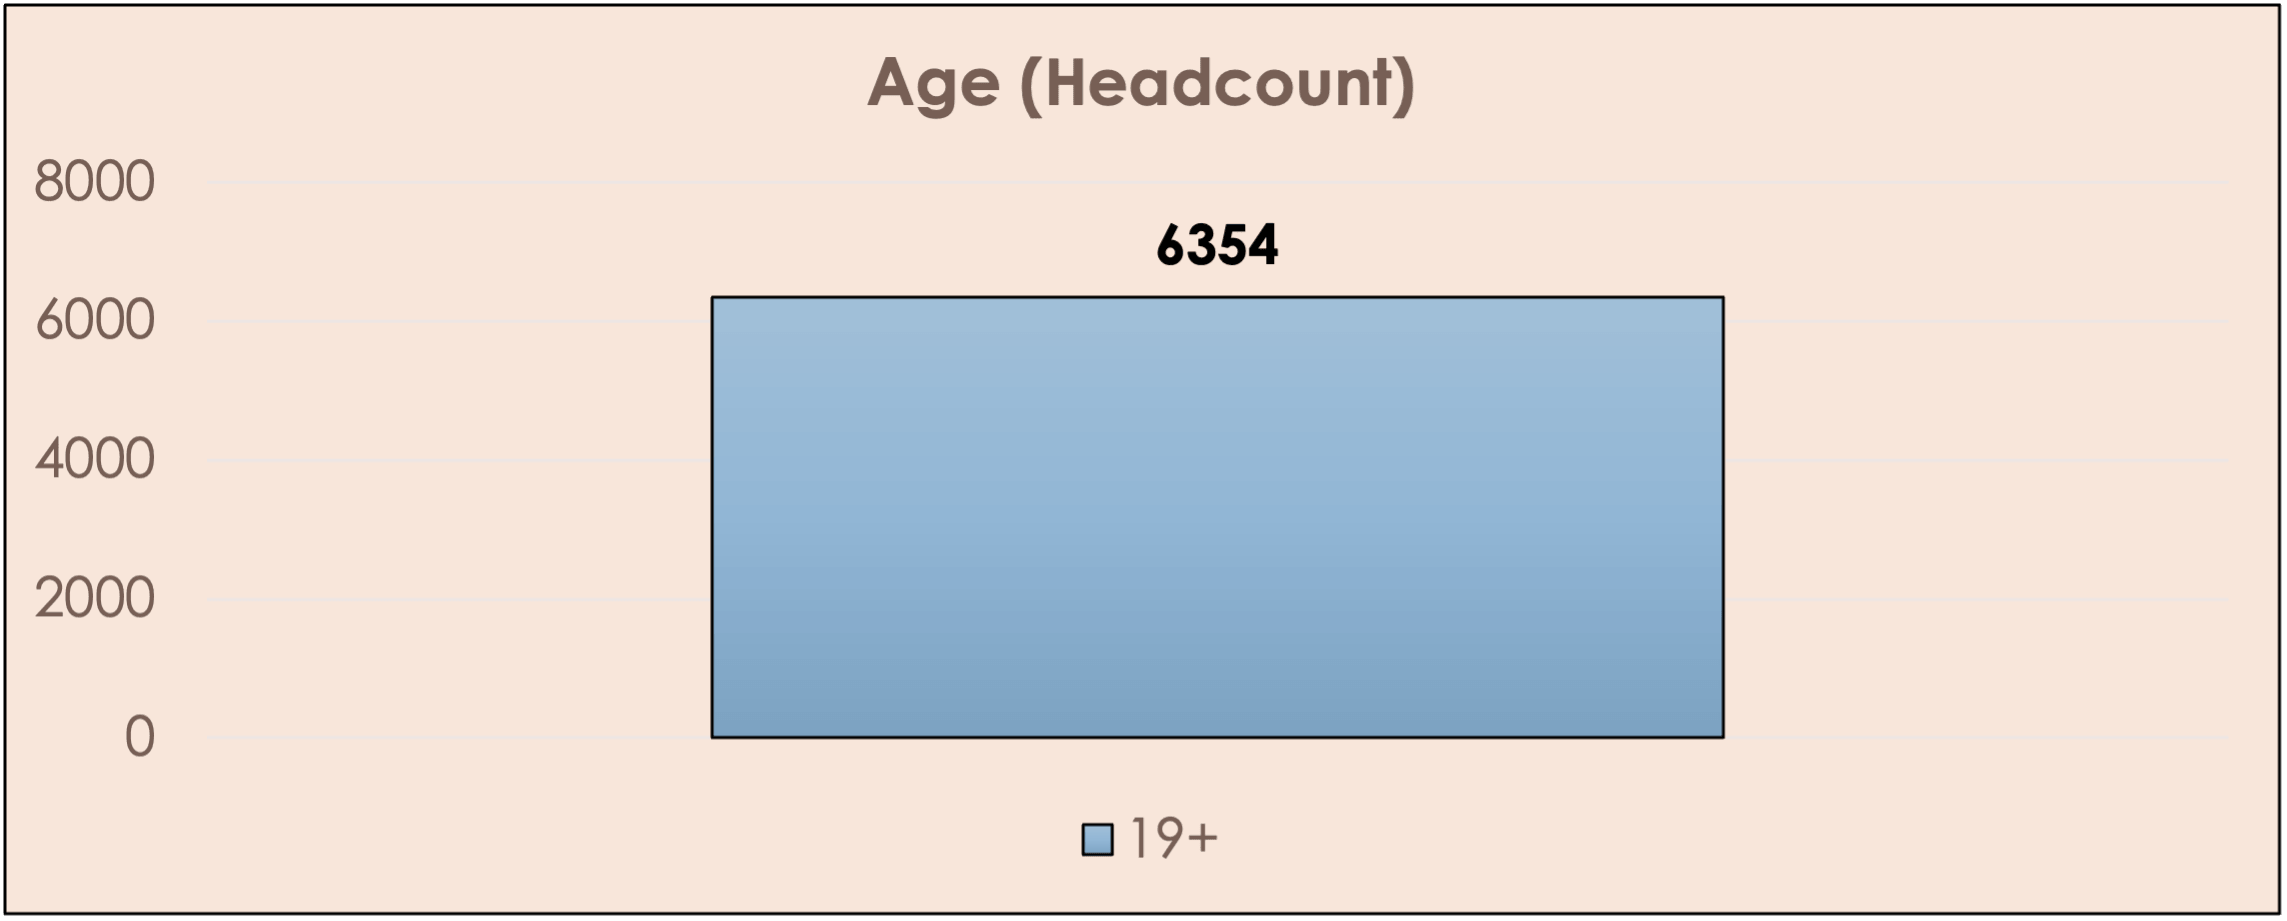
All learners in this group are aged 19+.
| Age Group | Headcount |
|---|---|
| 19+ | 6,354 |
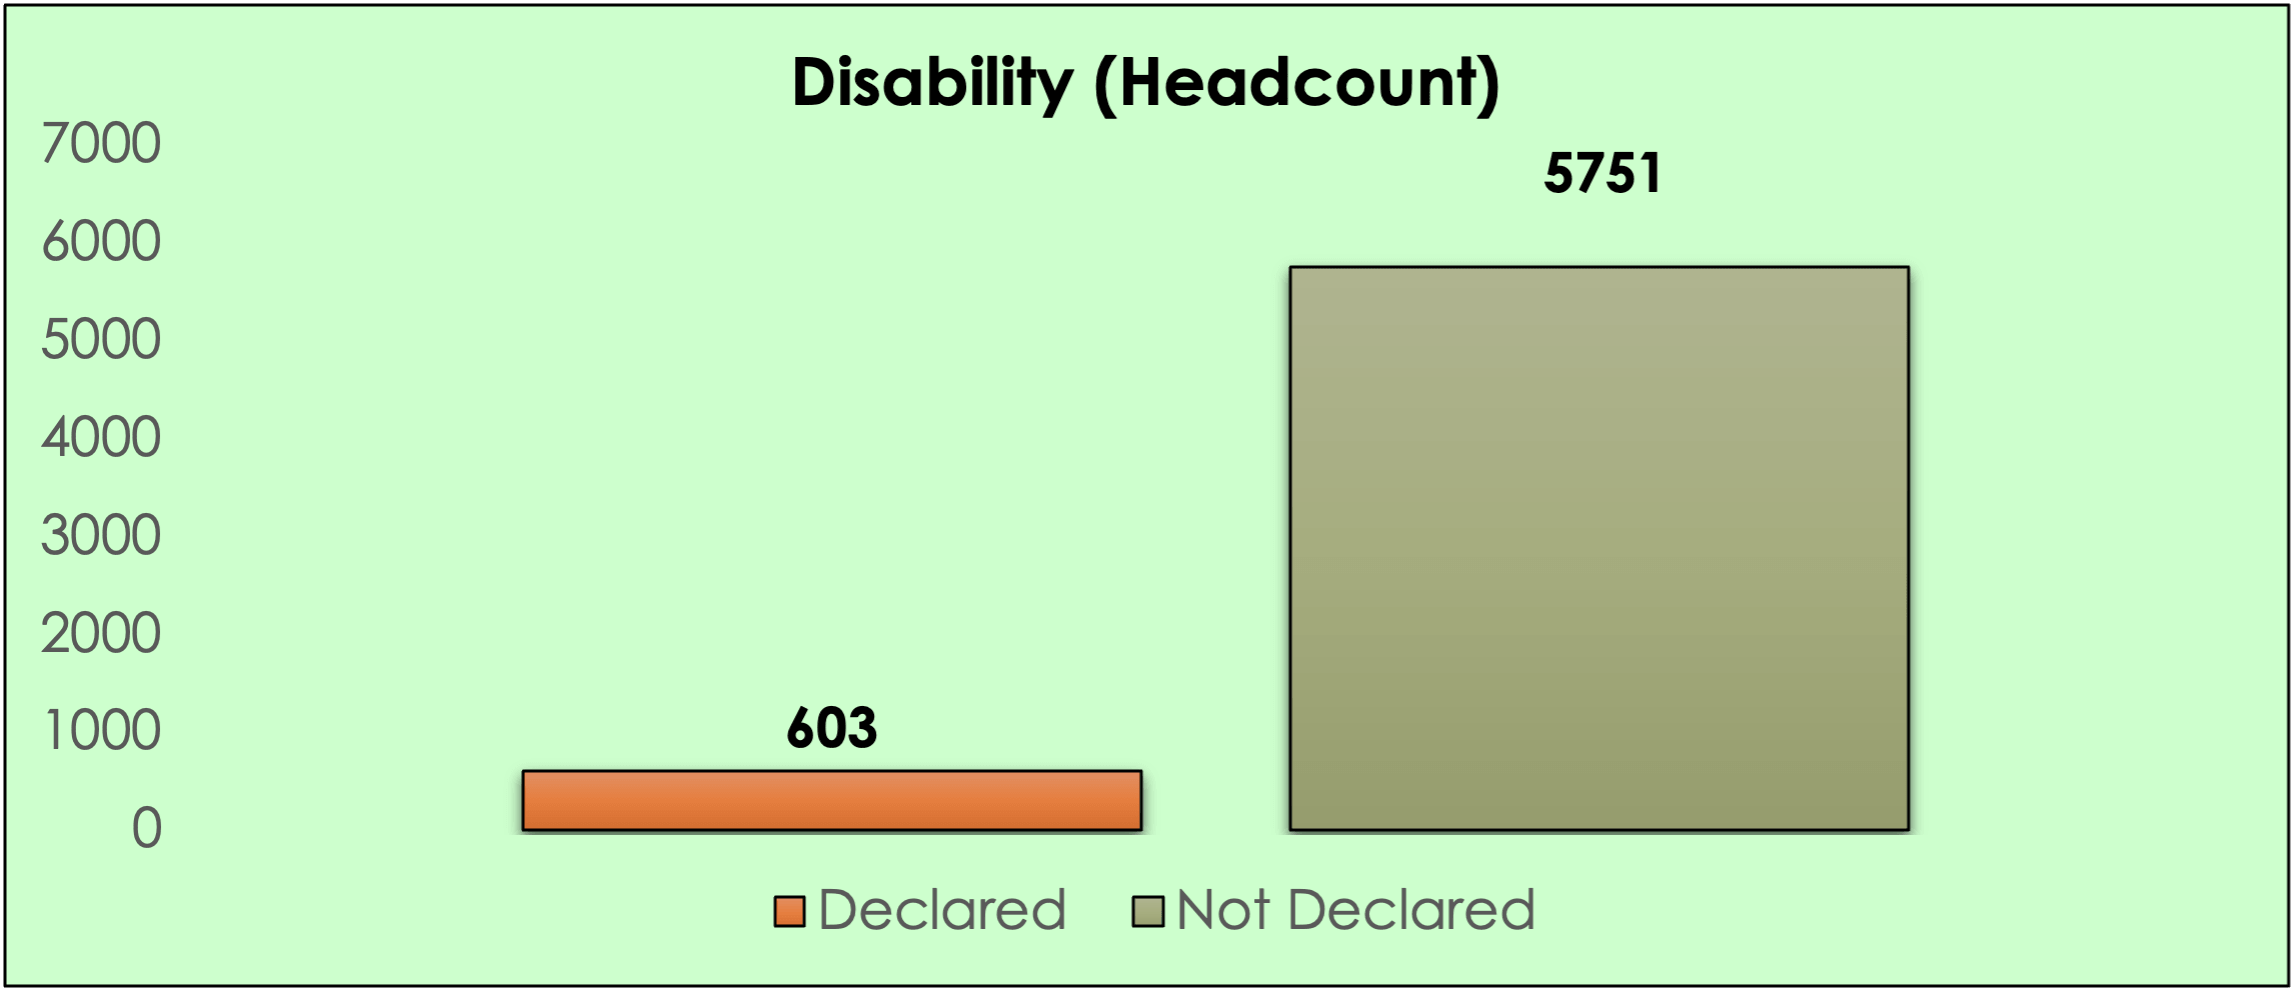
9.5% have declared a disability and 90.5% are not known to be disabled.
| Disability Status | Headcount |
|---|---|
| Declared | 603 |
| Not Declared | 5,751 |
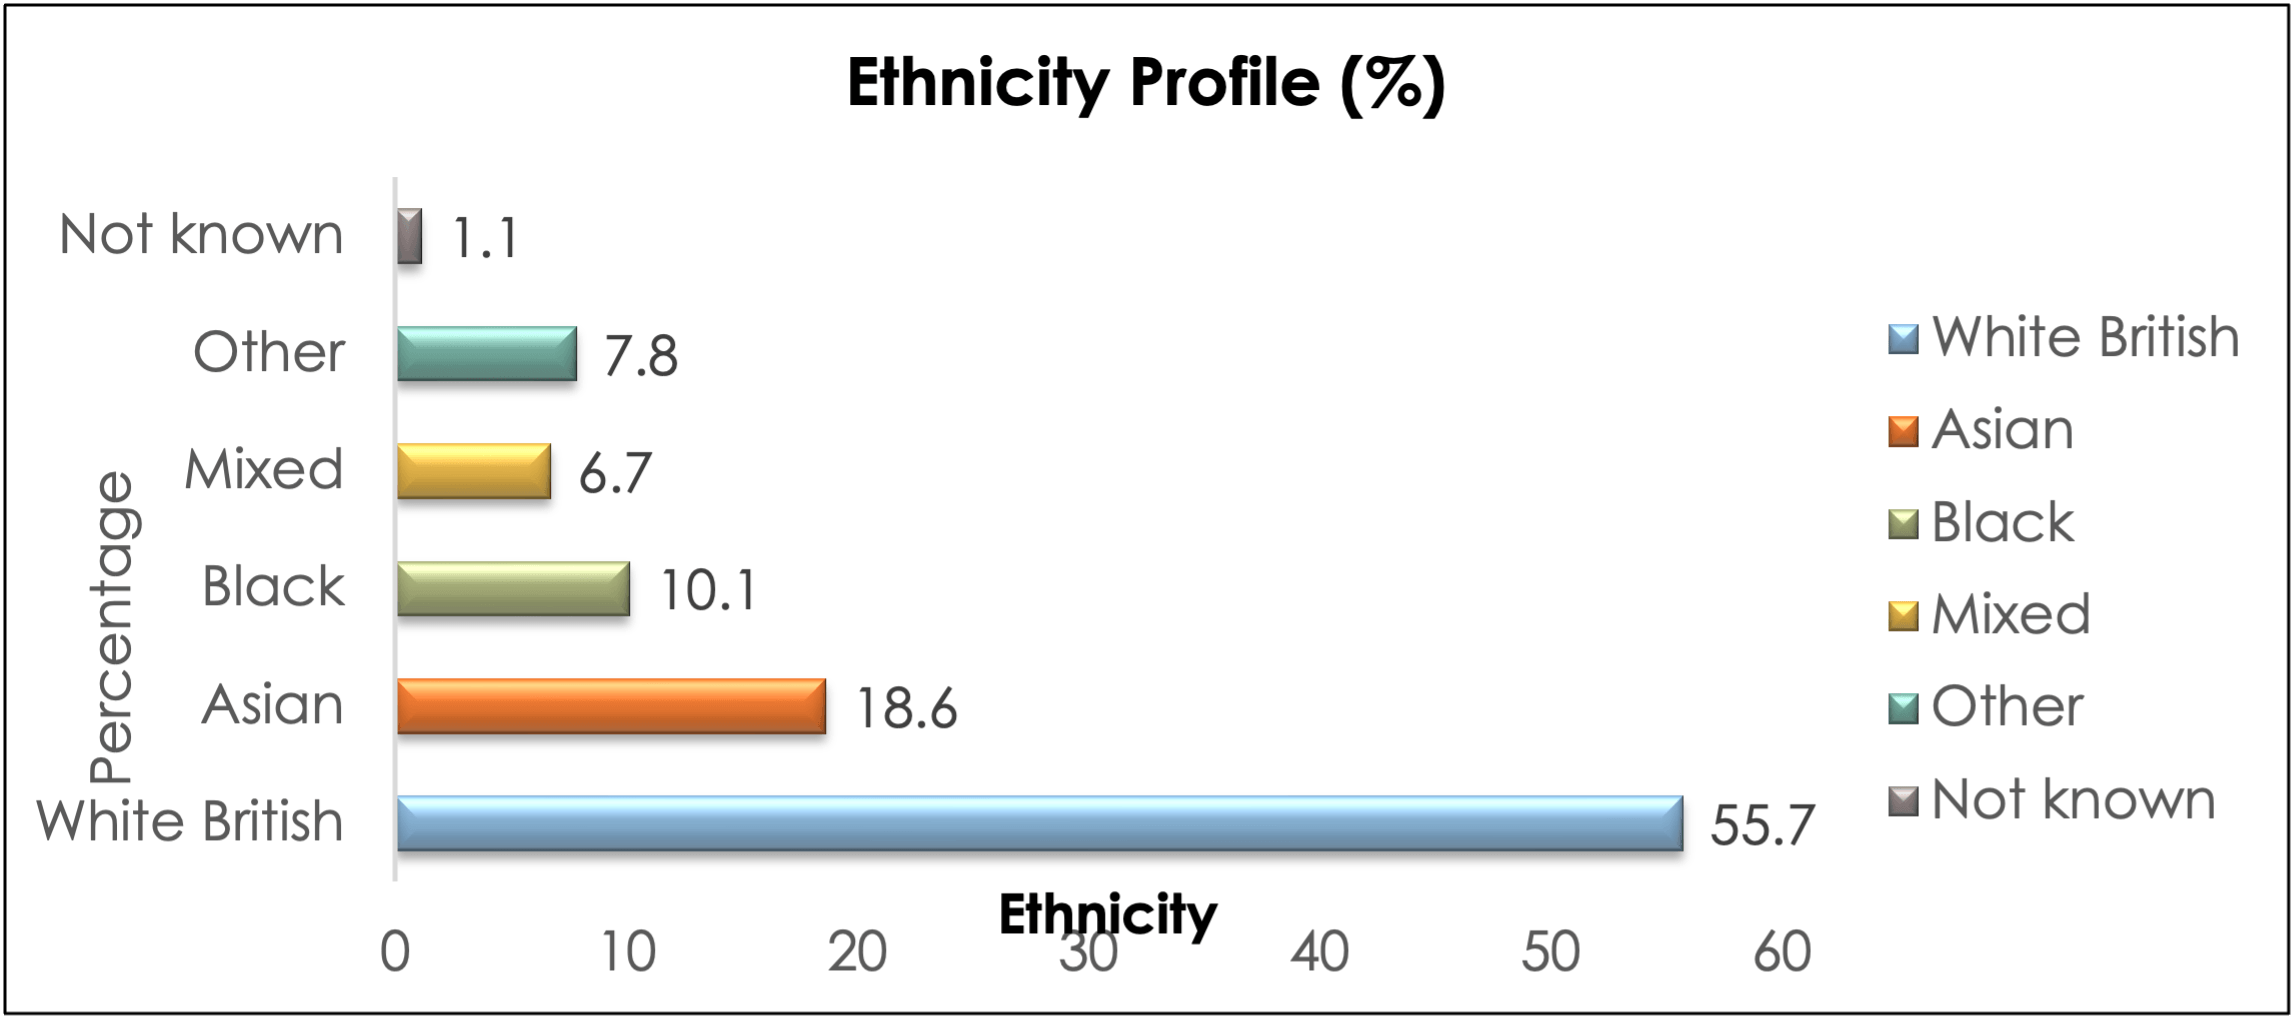
Over half are White British (55.7%), with significant representation from Asian (18.6%) and Black (10.1%) backgrounds.
| Ethnicity | Percentage |
|---|---|
| White British | 55.7% |
| Asian | 18.6% |
| Black | 10.1% |
| Mixed | 6.7% |
| Other | 7.8% |
| Not known | 1.1% |
The student profile across TSCG reflects a large, diverse population, with Adults (6,354) and Young People (5,518) representing the largest cohorts, alongside significant Apprenticeship (1,071) and Higher Education (521) provision. This breadth reinforces the importance of a differentiated and inclusive approach to curriculum design, learner support, and progression.
Gender representation varies by provision, with males overrepresented in Apprenticeship and Young People cohorts, and females forming a majority within Adult and Higher Education provision. This variation highlights the continued need to address gender participation patterns, particularly in traditionally gender-segregated pathways.
The age profile shows expected concentrations: Apprenticeships are largely 19+, Young People provision is predominantly 16–18, and Adult and Higher Education learners are overwhelmingly aged 19+, with a substantial proportion aged 24+. This distribution underscores the importance of flexible delivery models and support mechanisms that reflect learners’ wider life commitments.
Disability declaration rates range from approximately 7–14% across provisions, with higher declaration within Adult and Young People cohorts. When combined with the increasing numbers of learners with EHCPs and High Needs, this remains a key contextual factor influencing achievement outcomes and reinforces the importance of targeted, specialist support.
Ethnic diversity varies across provision types. While White British learners remain the largest group overall, there is significant representation from Asian, Black, Mixed and Other ethnic backgrounds—particularly within Adult and Young People cohorts. This diversity strengthens the case for culturally responsive teaching practices and inclusive student support.
Overall, the data highlights both the scale of TSCG’s impact and the complexity of learner need. The profile reinforces the importance of TSCG’s strategic focus on equity, targeted intervention, and inclusive practice to support achievement, progression, and positive outcomes for all learners.
A key success this year has been the continued development of an inclusive organisational culture, driven by staff engagement and leadership.
Key achievements include:
These initiatives have contributed to:
TSCG has made notable progress in improving workforce data transparency and representation.
Key developments include:
These improvements demonstrate that targeted work on staff confidence, communication and engagement is having a measurable impact.
Significant work has been done to ensure that recruitment and progression opportunities are inclusive:
These actions are helping to:
TSCG has strengthened mechanisms for capturing and responding to staff voices:
Feedback indicates that:
Progress has also been made in creating environments where staff can be themselves:
These actions support the strategic aim of enabling staff to “be their authentic self within the workplace”.
EDI work has been recognised and celebrated through:
This has helped to:
TSCG continues to play a key role as a community anchor institution, with strong partnerships supporting EDI.
These initiatives have:
Compared with 2023–24, the 2024–25 workforce profile shows a slight increase in female staff (+3.7%) and a slight decrease in male staff (−3.8%), resulting in a modest overall headcount rise of +0.9%. Teaching roles accounted for the vast majority of the increase in female staff and the reduction in male headcount was primarily driven by Business Support roles.
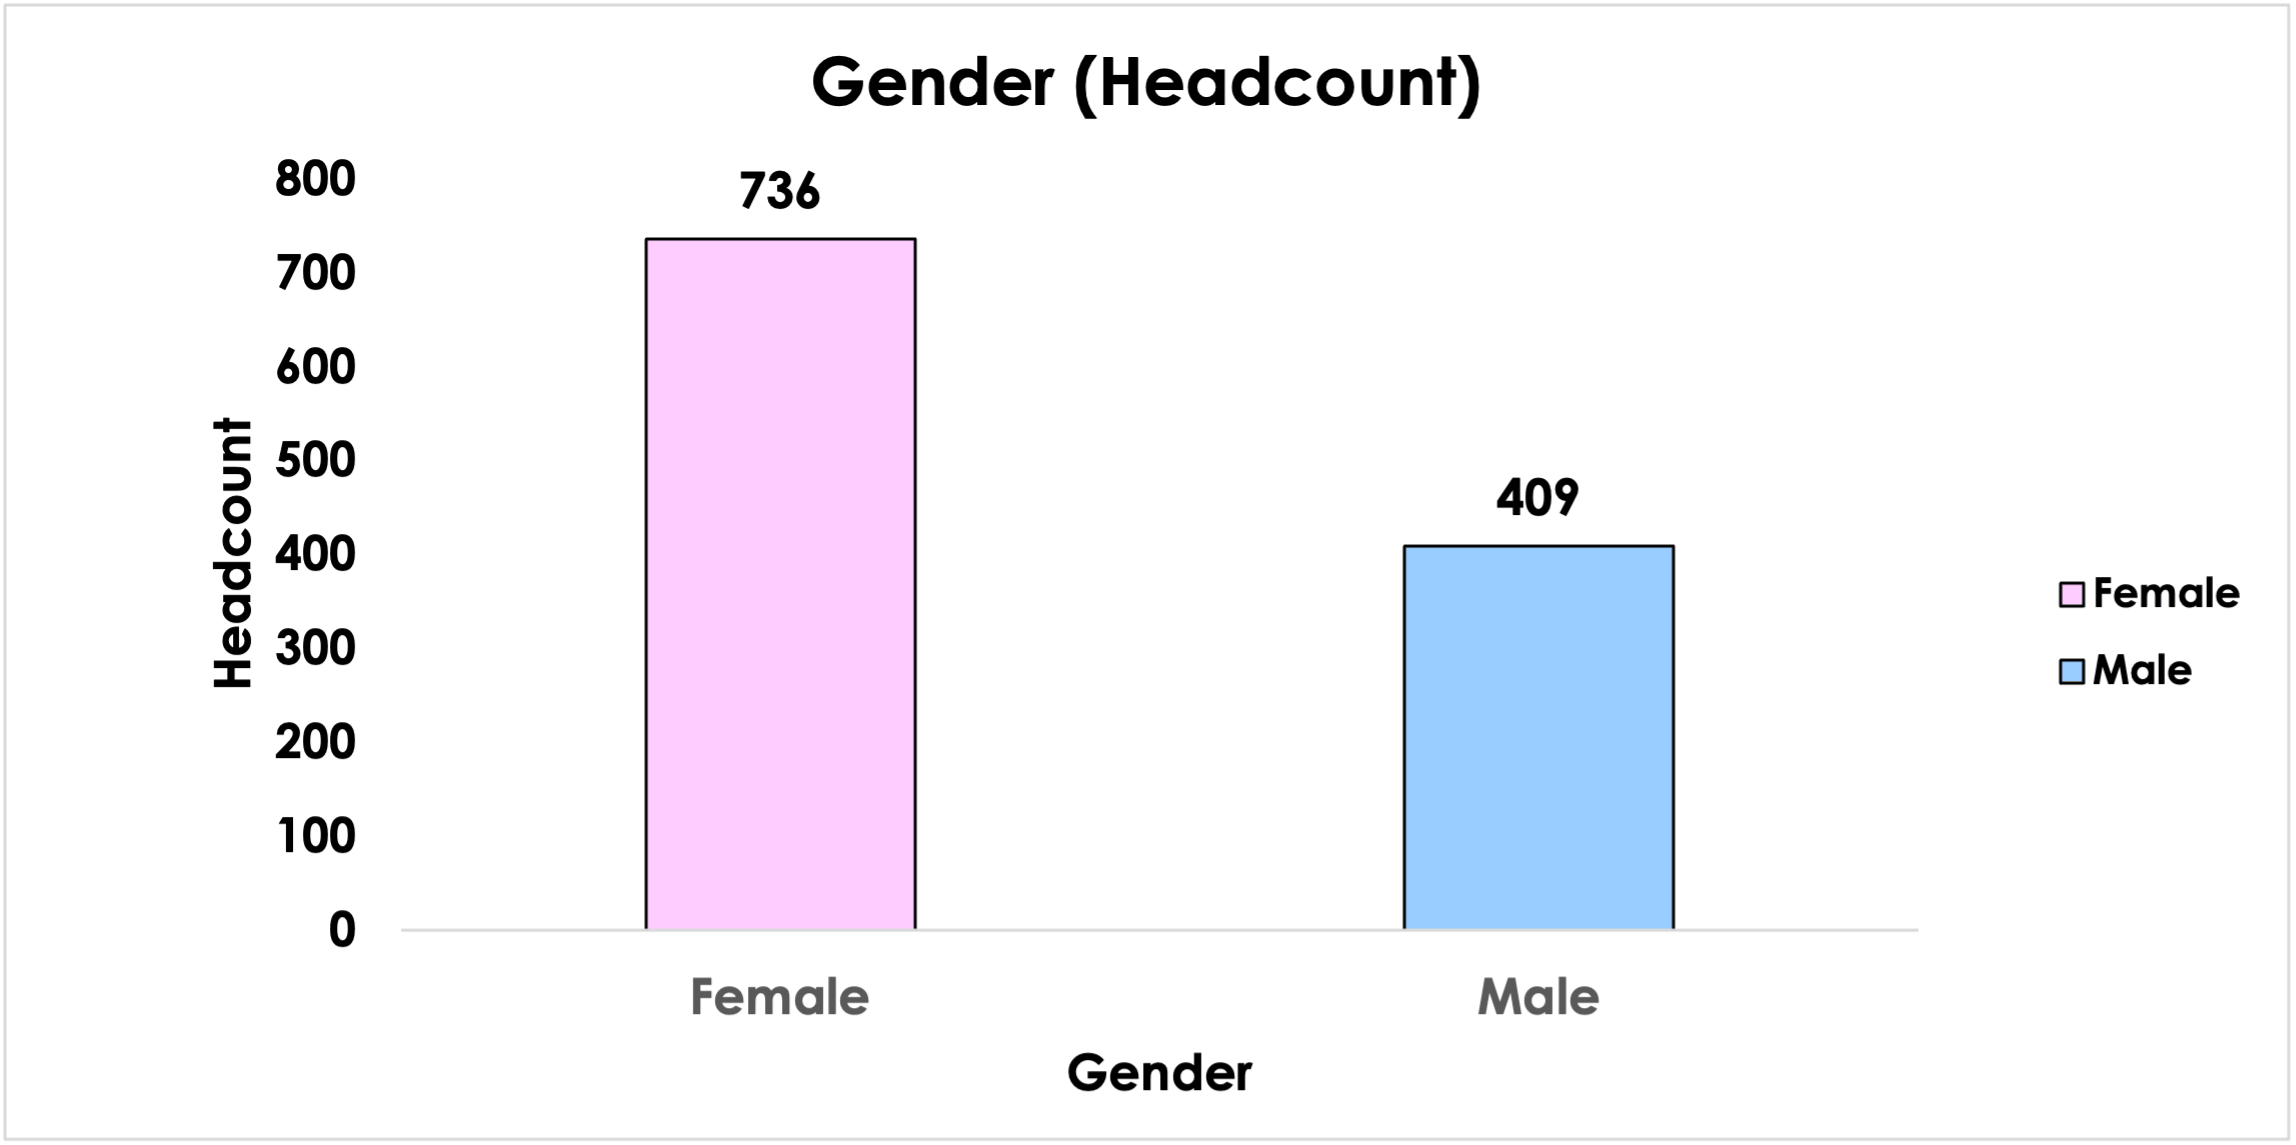
| Gender | Headcount |
|---|---|
| Female | 736 |
| Male | 409 |
Compared with 2023–24, 2024–25 shows a modest overall increase in headcount (+0.9%), driven by a rise in female staff (+3.7%) alongside a small reduction in male staff (−3.8%).
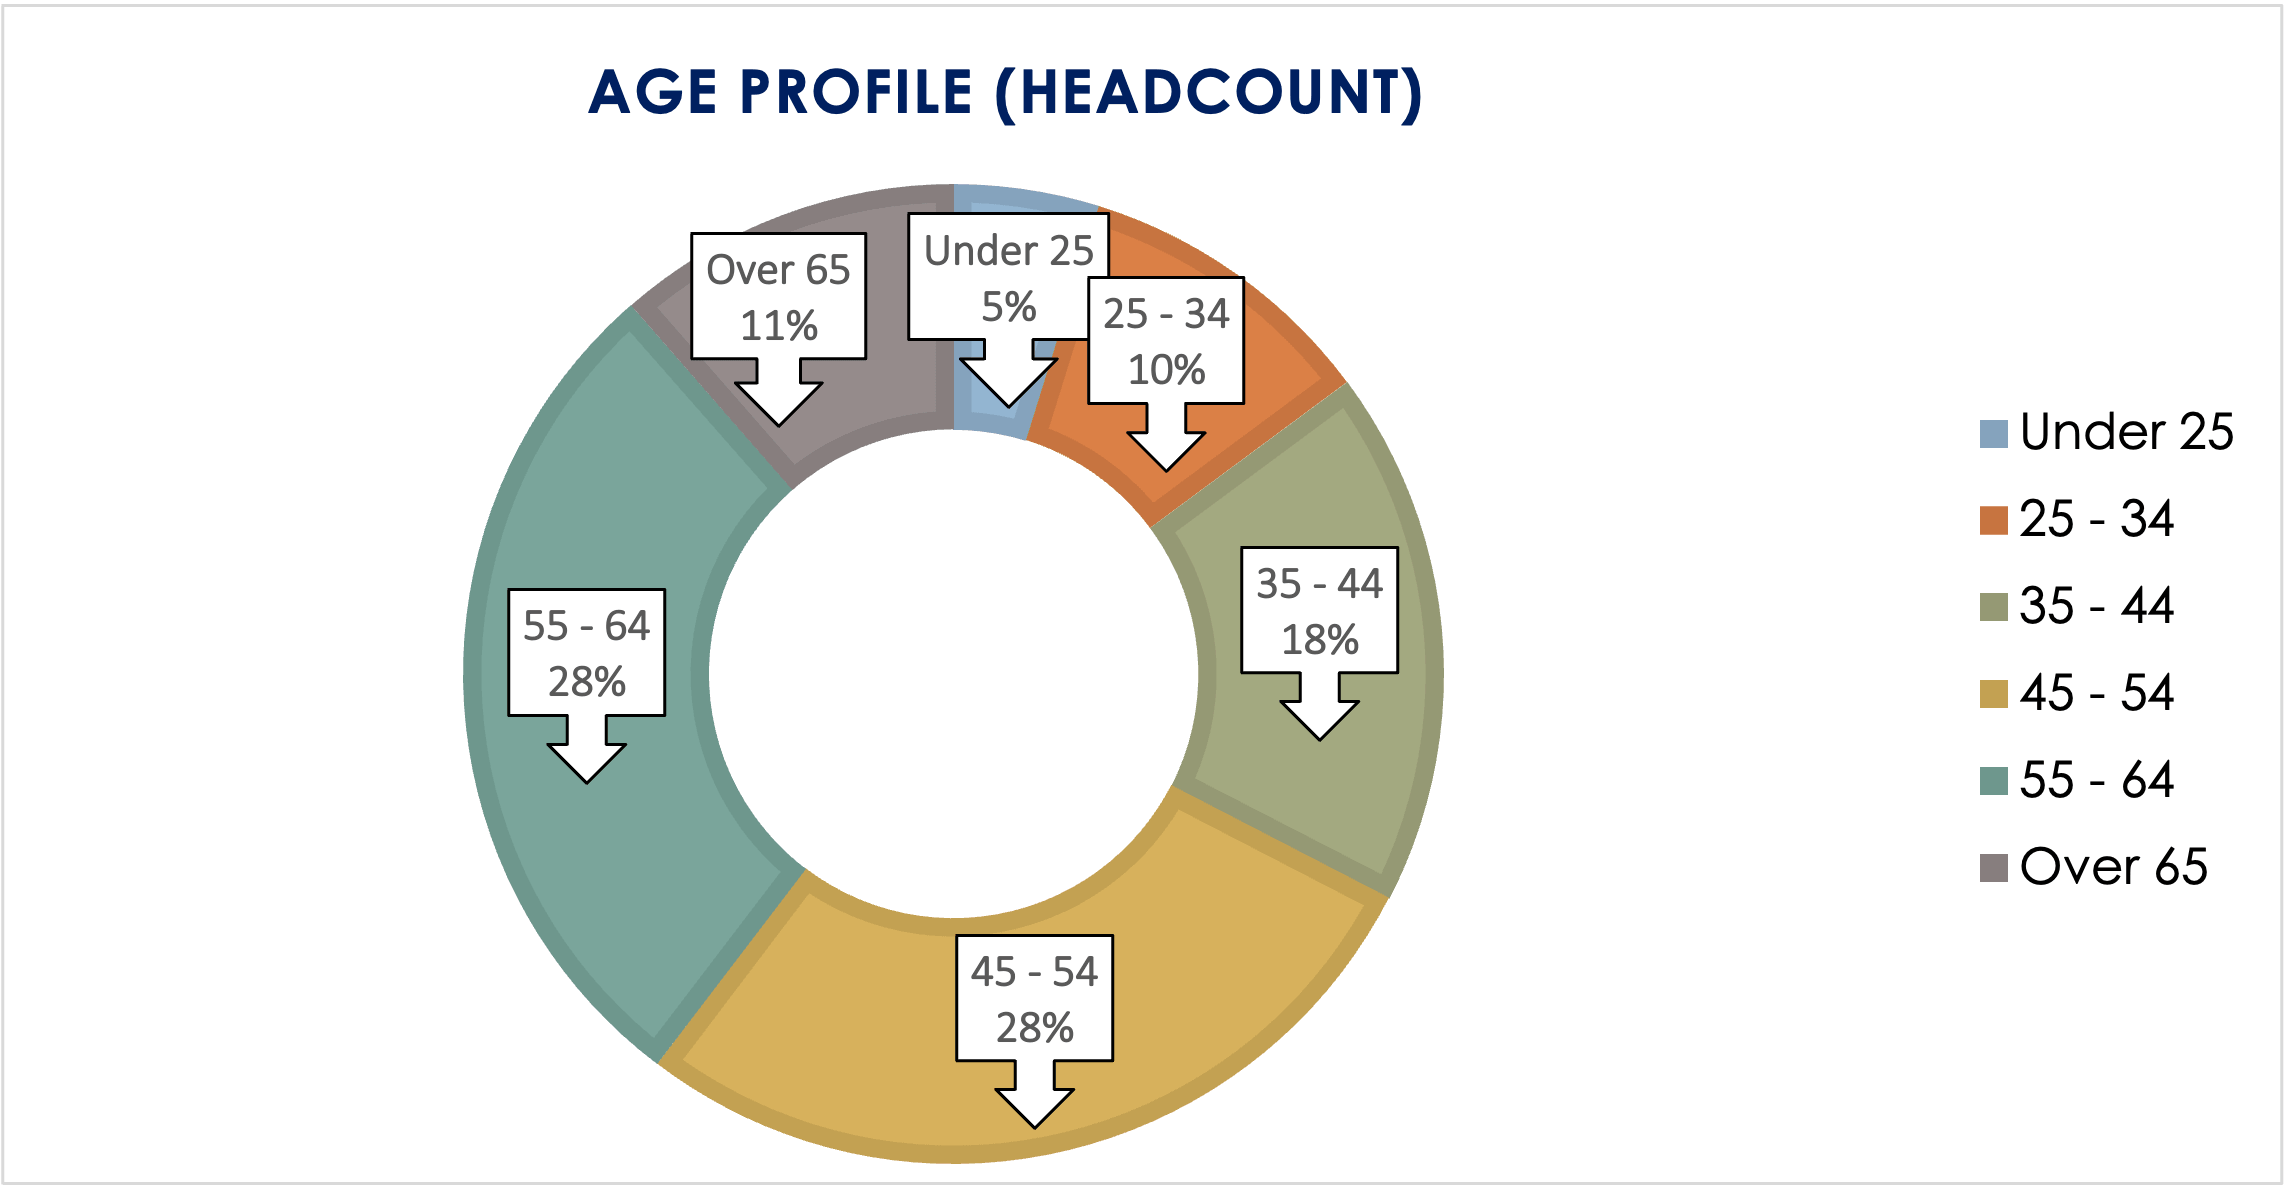
| Age Group | Percentage |
|---|---|
| Under 25 | 5% |
| 25–34 | 10% |
| 35–44 | 18% |
| 45–54 | 28% |
| 55–64 | 28% |
| Over 65 | 11% |
Compared with 2023–24, the number of staff disclosing a disability increased slightly in 2024–25 (66 to 70), rising from 5.8% to 6.1% of the workforce (+0.3 percentage points).
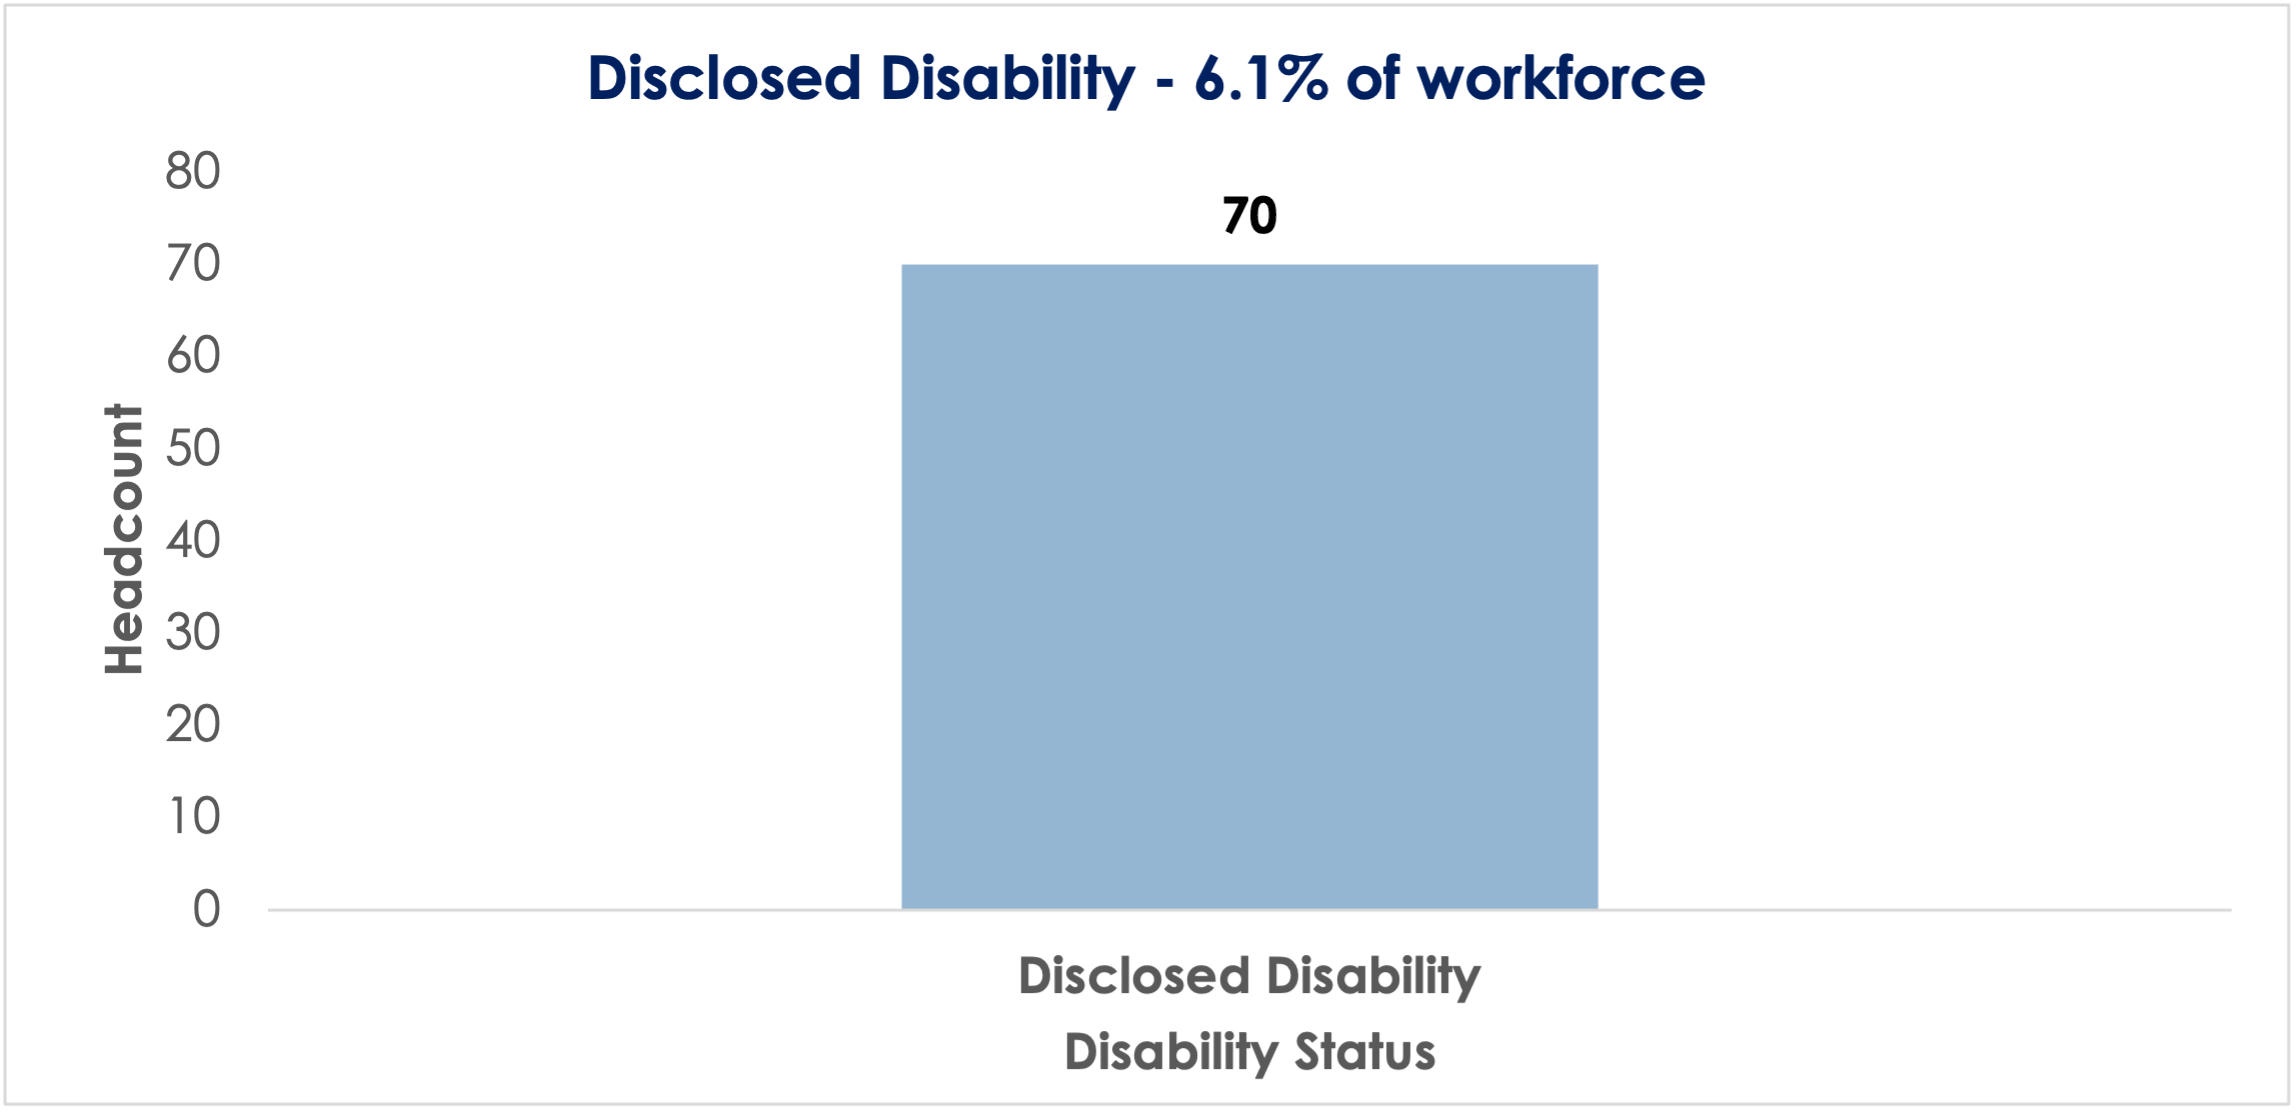
| Disability Status | Headcount | % of Workforce |
|---|---|---|
| Disclosed Disability | 70 | 6.1% |
Compared with 2023–24, 2024–25 shows a marked increase in staff recorded as Not Disclosed for sexual orientation (31.8% to 48.9%), with a corresponding reduction in recorded heterosexual and other disclosed categories. The increase in not disclosed is partly attributable to a higher proportion of new starters who have not completed the EDI data disclosure equating to 30%.
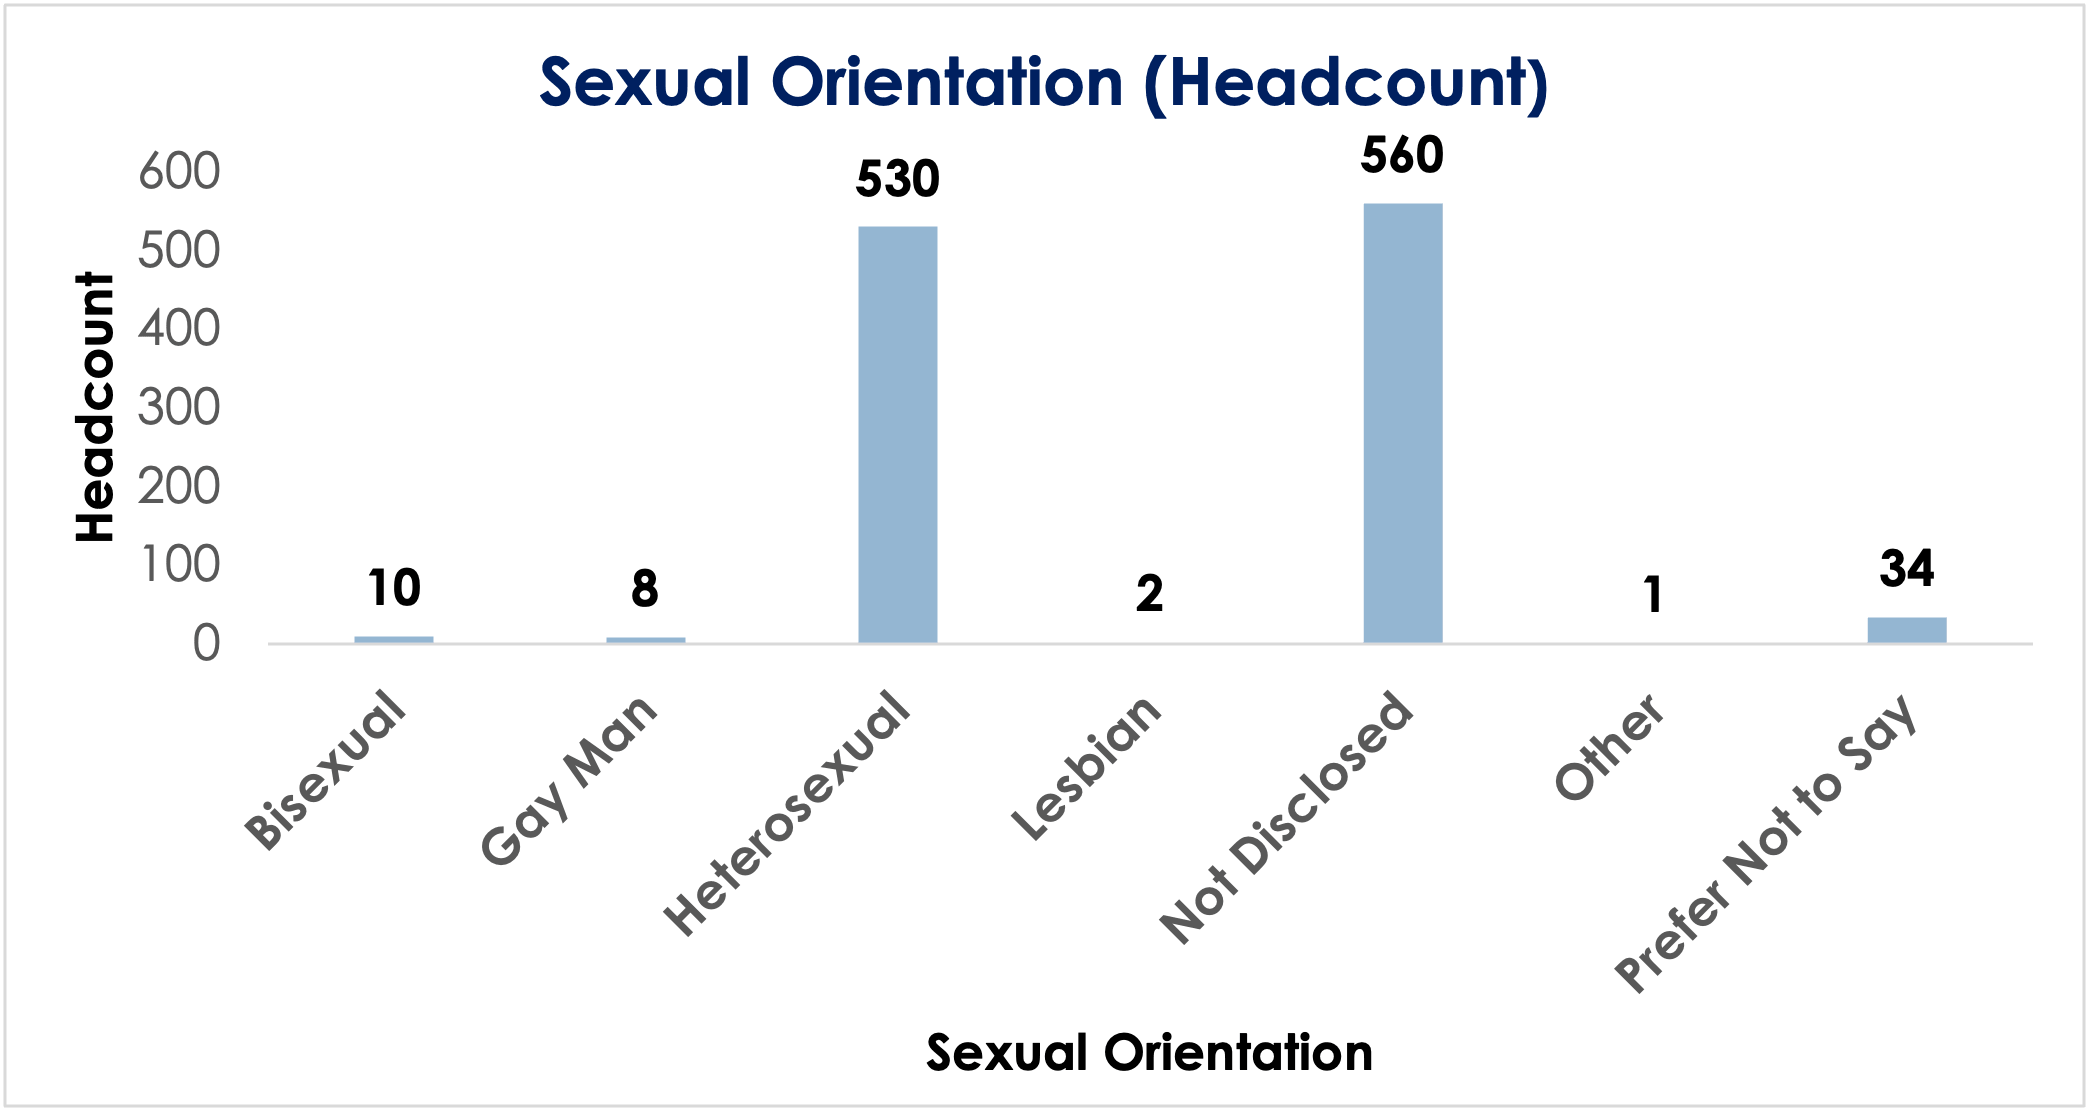
| Sexual Orientation | Headcount |
|---|---|
| Bisexual | 10 |
| Gay Man | 8 |
| Heterosexual | 530 |
| Lesbian | 2 |
| Not Disclosed | 560 |
| Other | 1 |
| Prefer Not to Say | 34 |
Compared with 2023–24, 2024–25 shows a lower proportion of staff recorded as “Majority” ethnicity (51.2% to 41.2%) and a higher proportion classed as “Not stated” (31.3% to 44.1%), with a small reduction in “Minority” representation (17.5% to 14.7%). The increase in not disclosed is partly attributable to a higher proportion of new starters who have not completed the EDI data disclosure.
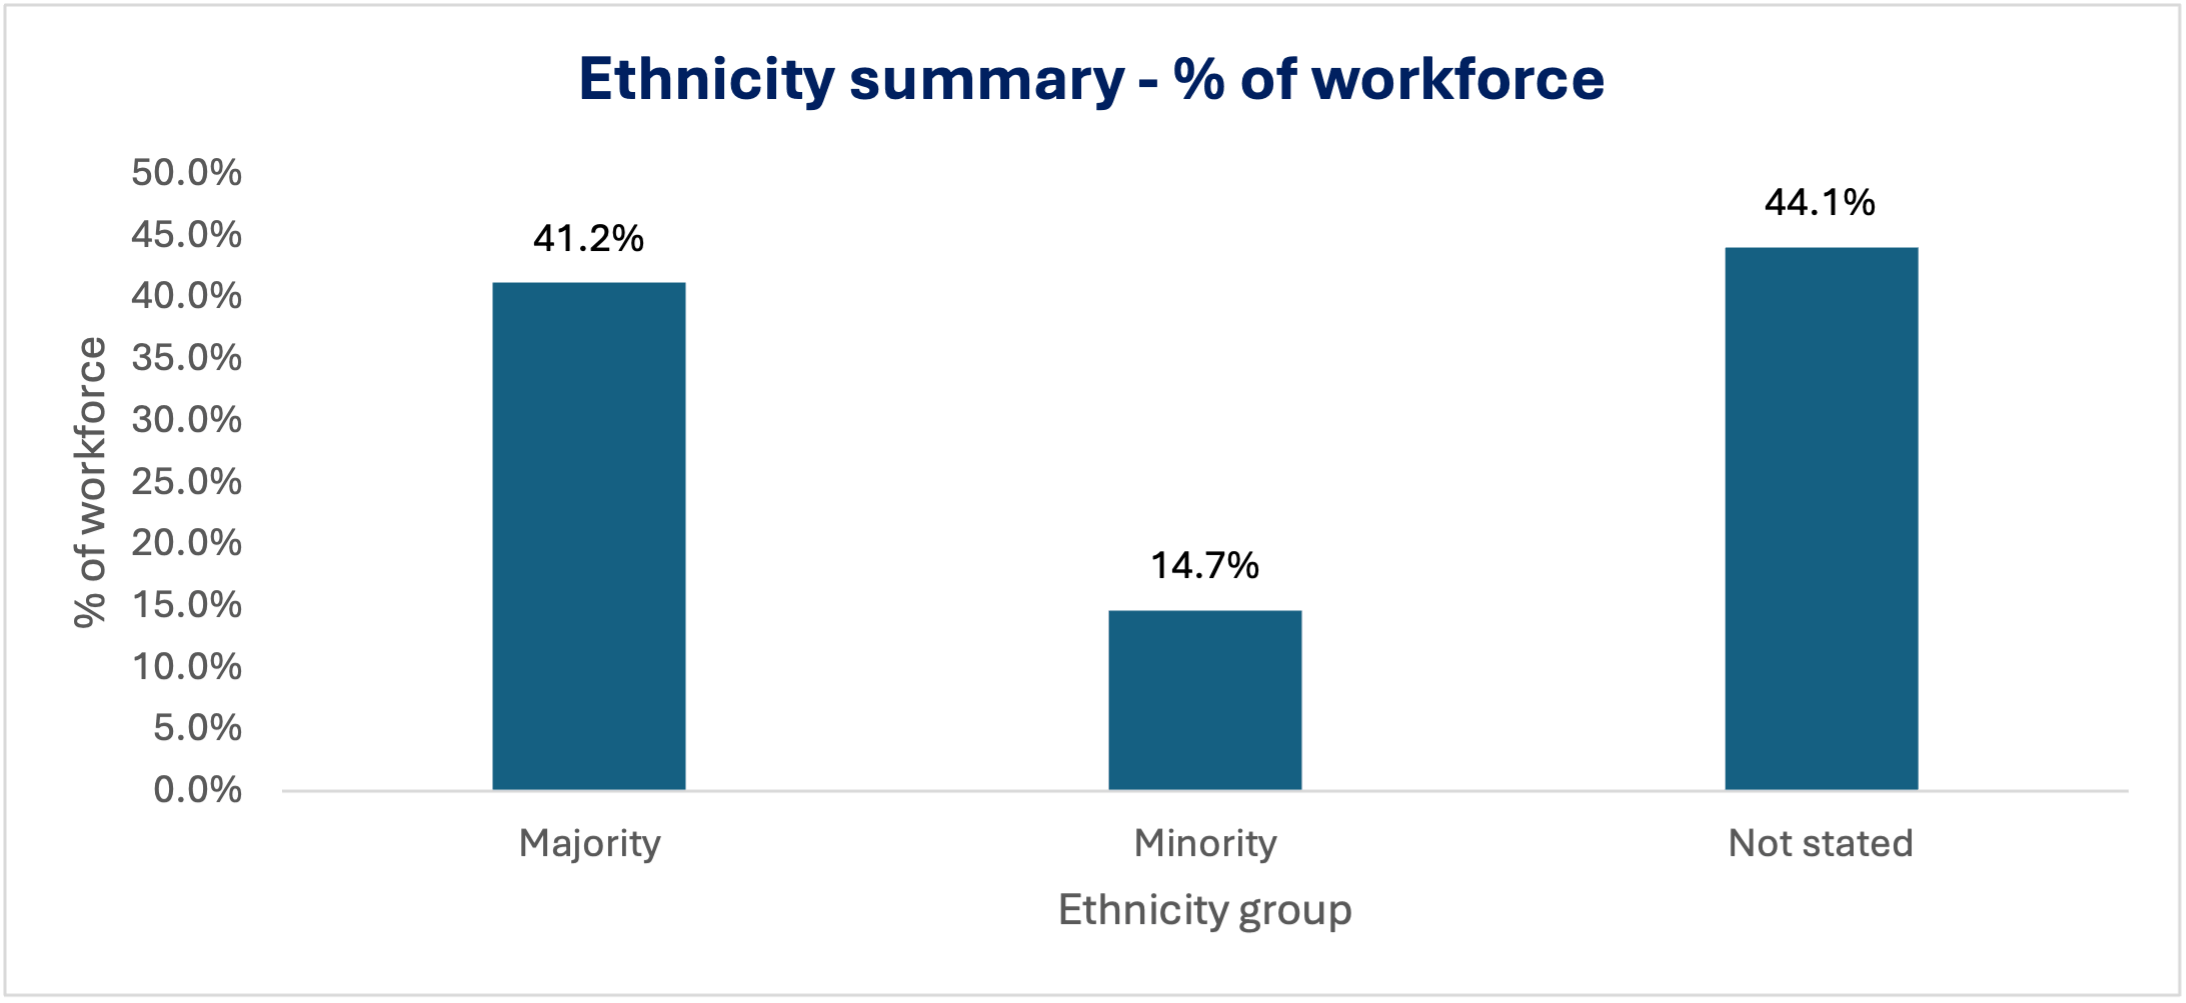
| Ethnicity Category | % of Workforce |
|---|---|
| Majority | 41.2% |
| Minority | 14.7% |
| Not stated | 44.1% |
Building on the progress made in 2024–2025, TSCG will focus on:
At Trafford and Stockport College Group, we are committed to ensuring fairness, transparency and equality in pay for all colleagues. We operate robust and objective pay structures and can confirm that men and women are paid equally for the same or equivalent work.
The gender pay gap, however, is a different measure. It reflects the distribution of men and women across different roles and pay levels within the organisation, rather than unequal pay practices.
The 2024–2025 reporting year demonstrates continued positive progress, with further reductions in both mean and median gender pay gap measures. This reflects sustained organisational efforts to improve workforce balance, strengthen inclusive recruitment and support career progression across all staff groups.
At the snapshot date of 31 March 2025:
The reduction in the median pay gap to below 1% represents a significant milestone, indicating that pay at the midpoint of the organisation is now close to parity between men and women.
This places TSCG in a strong position compared to the national context, where the median gender pay gap remains significantly higher.
TSCG remains committed to further reducing the gender pay gap and strengthening gender equality across the organisation.
Key priorities include:
The 2024–2025 academic year has seen significant progress in embedding EDI across Trafford and Stockport College Group, particularly from a staff perspective.
The organisation has:
While challenges remain, particularly in closing attainment gaps and further improving representation, the progress made demonstrates a clear trajectory towards a more inclusive, equitable and high-performing organisation.